Apple (AAPL) is the most influential stock considering all its branches and its psychological effect, not to mention its $510 billion market cap. But all is not well technically for AAPL and we're going to soon find out if it can hold support and resume its uptrend or if it potentially has much more downside to go. Why? Because the 93.00 level has been excellent support for the past few years. In September 2012, AAPL had an intraday high of 93.11. It took nearly two years for AAPL to climb back up to test that 93.00 resistance before finally breaking through. Since its breakout, we've seen tests of 93.00 support in September and October of 2014, then again during the August flash crash in 2015 and one more time in January/February of this year as the overall market found a significant bottom. But with the S&P 500 well off its February low, AAPL has been performing miserably on a relative basis and now is on the cusp of a very serious technical price breakdown at 93.00. Here's the latest visual on AAPL:
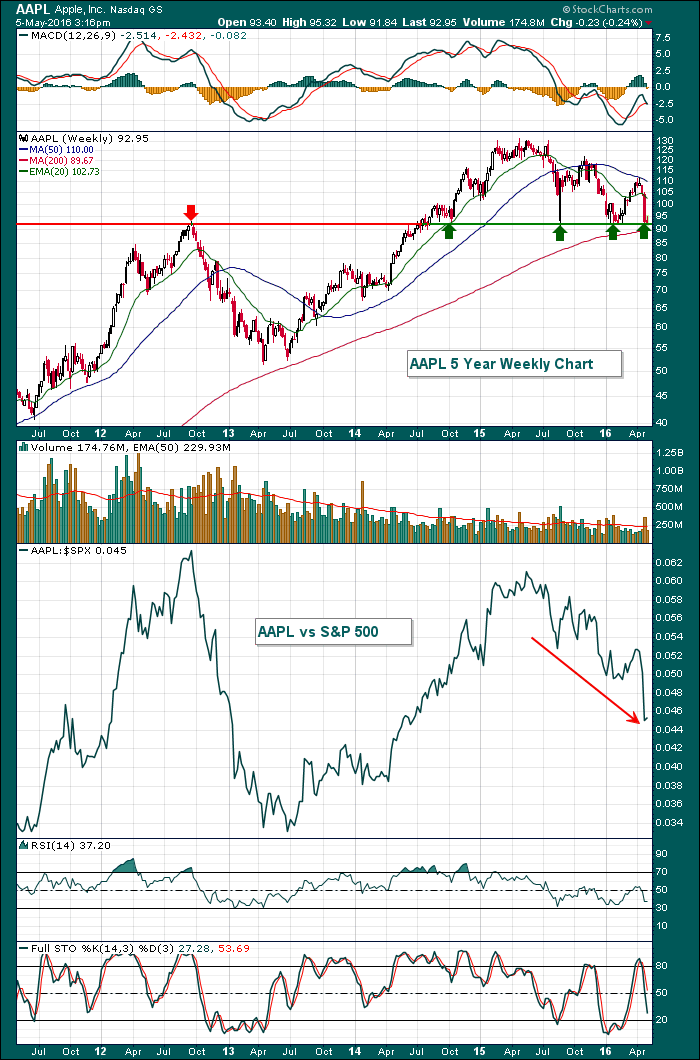 The good news is that price support hasn't been lost. The bad news, however, is that while price support has been holding, relative strength (vs. the S&P 500) has been spiraling downward. A loss of price support sets AAPL up for much deeper selling and likely underperformance by the technology area in general.
Happy trading!
Tom
