Amazon.com (AMZN) has been one of the strongest performers in 2016 and just recently broke out on a relative basis vs. the S&P 500 when it impressed Wall Street with its latest quarterly earnings results. But there are now a couple warning signs that indicate AMZN may be at or near a short-term peak. First, its lastest price high has occurred with a lower MACD reading, a sign of slowing momentum. The MACD, however, does not take into account volume so I prefer to see volume slowing on the breakout to confirm the weak momentum. That's exactly what's happening. Check this out:
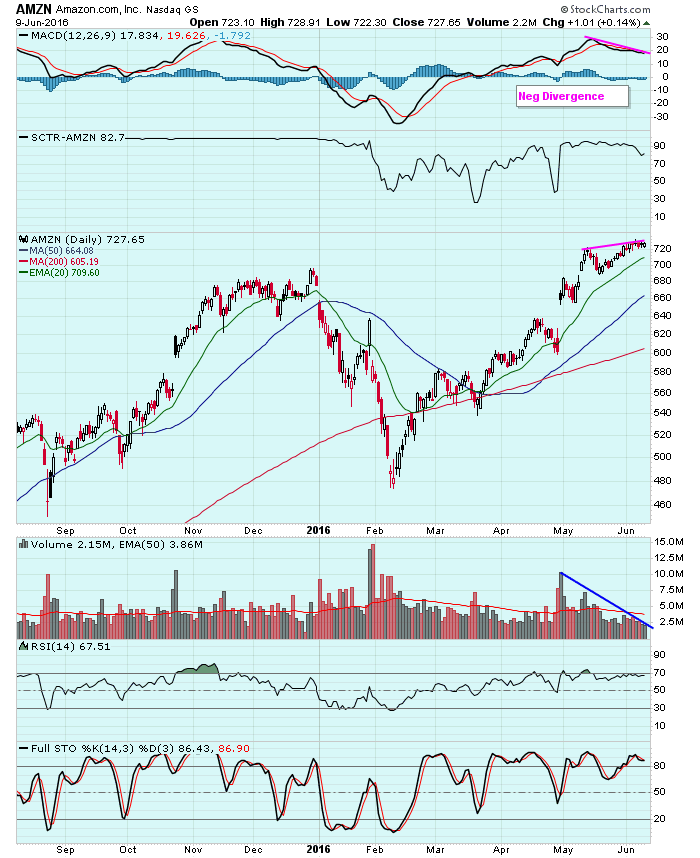 Volume has been steadily declining since the earnings-related breakout in late April. AMZN is near overbought levels and a negative divergence has printed. All of these are warning signs and it isn't helping that AMZN's five week SCTR stretch in the 90s broke. I wouldn't be surprised to see an upcoming 50 day SMA test.
Happy trading!
Tom


