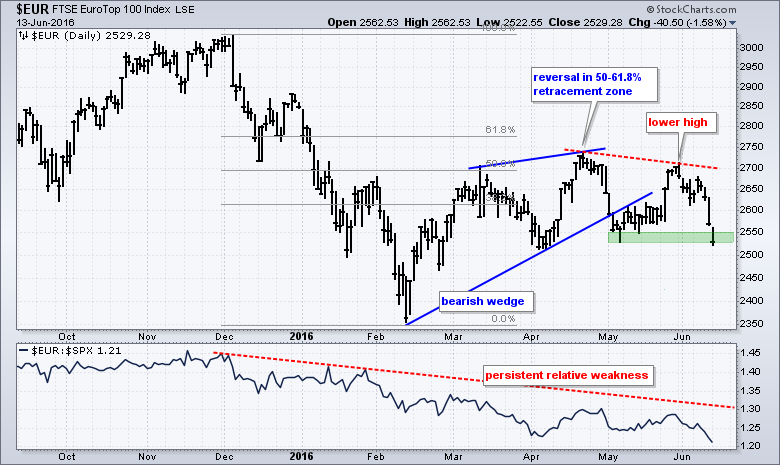
Large-caps in Europe continue to underperform large-caps in the US and the EuroTop 100 ($EUR) is breaking down on the price chart. First, the price chart shows $EUR falling sharply from December to mid February and then recovering 50-61.8% of this decline with a bounce back to the 2700-2750 area. This bounce formed a rising wedge and the index then broke the wedge trend line in early May. Overall, the decline looks like the dominant price move and the wedge looks like a counter-trend advance (correction). The early May breakdown ended this counter-trend advance and signaled a continuation of the bigger downtrend.
It looked as if the index was going to ignore the wedge breakdown after the late May surge back to 2700. However, a lower high ultimately formed and the index moved below the early May low today. Price action clearly shows more selling pressure than buying pressure in this index. Perhaps Brexit uncertainty is keeping buyers on the sidelines. $EUR is also severely lagging the S&P 500 because the price relative ($EUR:$SPX ratio) has been trending lower since early December and hit a multi-month low here in June.
****************************************
Thanks for tuning in and have a great day!
--Arthur Hill CMT
Plan your Trade and Trade your Plan
*****************************************

