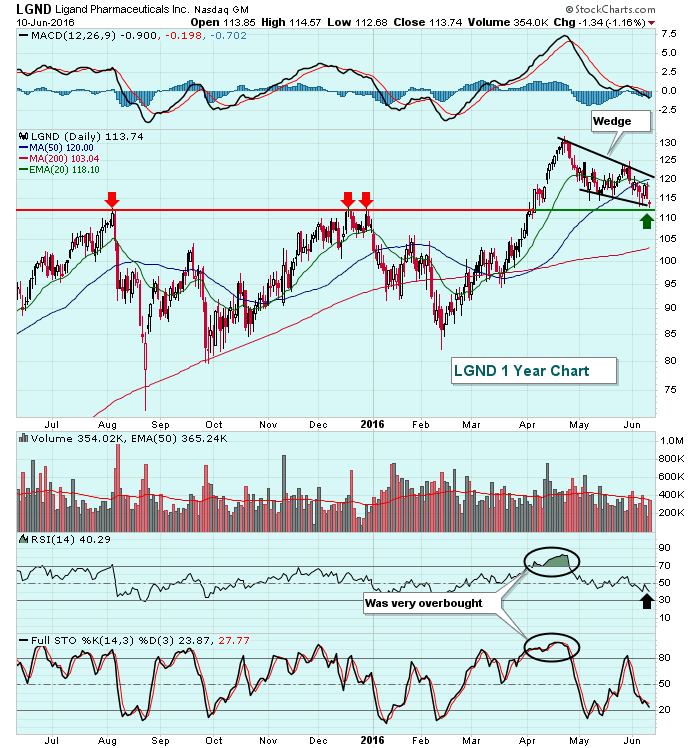
Ligand Pharmaceutical (LGND) broke out above price resistance in April with solid volume confirmation. But the stock was extremely overbought and in need of a pullback to unwind its momentum oscillators. RSI had touched the 80s with stochastic elevated in the 90s. LGND has lost approximately 12%-13% over the past six weeks as a bullish wedge has formed to drop the price back to price support from the April breakout. Check it out:
 The black arrow now shows the RSI near 40 and stochastic at 24, a much better reward to risk entry point.
Happy trading!
Tom

About the author:
Tom Bowley is the Chief Market Strategist of EarningsBeats.com, a company providing a research and educational platform for both investment professionals and individual investors. Tom writes a comprehensive Daily Market Report (DMR), providing guidance to EB.com members every day that the stock market is open. Tom has contributed technical expertise here at StockCharts.com since 2006 and has a fundamental background in public accounting as well, blending a unique skill set to approach the U.S. stock market.
Learn More


