Actually, Encana (ECA) has broken two downtrends - a short-term trend and a long-term trend. ECA hit its all-time high of roughly 42.50 just before this bull market began. Shareholders of ECA haven't seen much bullish action since this seven year bull market began, but technically things are improving on both their daily and weekly charts. Check them out:
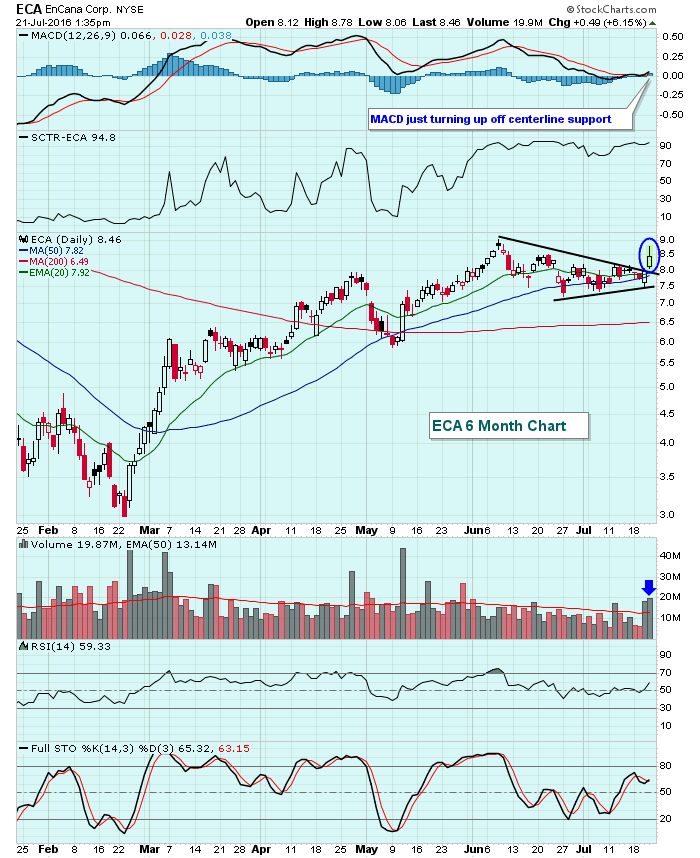 The daily chart shows that today's reaction to its better than expected earnings is a bullish triangle breakout with very heavy volume. But the longer-term weekly chart has been acting very bullishly as well:
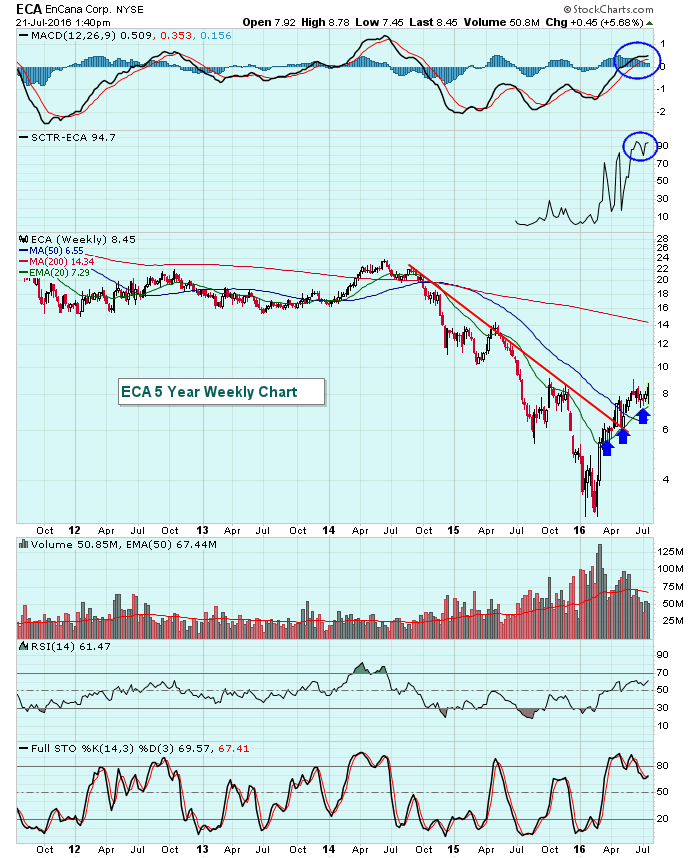 Note that recent pullbacks have been holding onto that rising 20 week EMA support and then bouncing. And now that both the daily and weekly MACDs are showing strengthening momentum, ECA appears to be a solid trading candidate with perhaps a stop below either 7.29 (20 week EMA) or 7.50 (triangle support on daily chart).
Happy trading!
Tom
