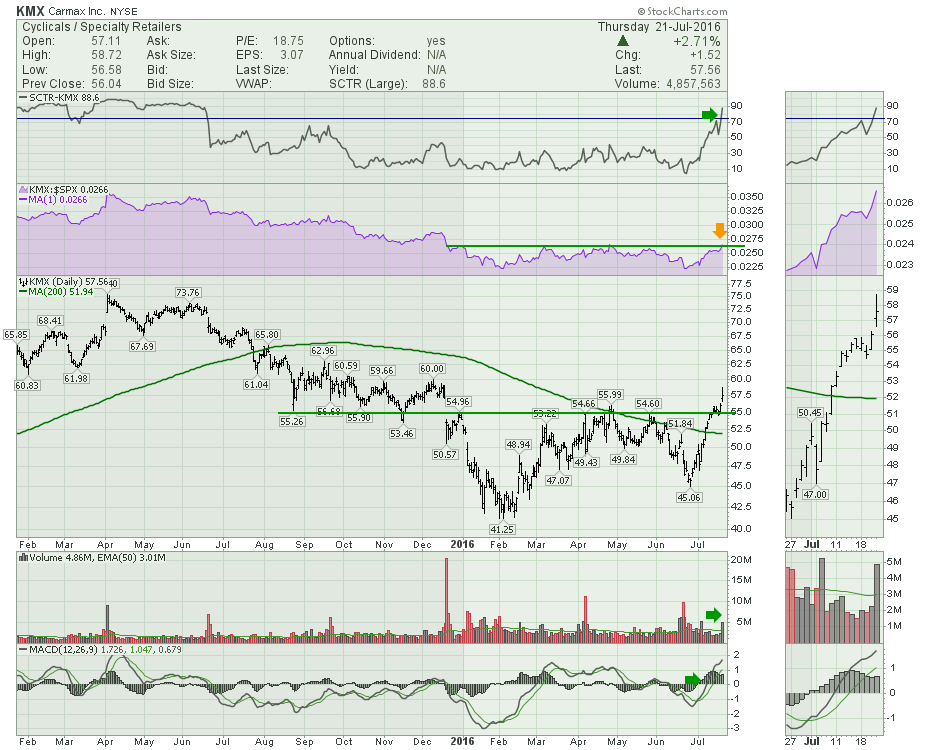
Carmax (KMX) has a great technical chart today. With the SCTR soaring to 88, the price action shows it is one of the best stocks out there. But there is a little more history on the SCTR that is important. One of the best parts about the SCTR is we can look at how it performs relative to its peers over time. To my knowledge, this is the only plottable indicator that keeps track of the relative ranking compared to its peers. It was over a year ago that KMX fell out of the top performer range above 75. That makes the stock difficult to hold to me. If it is not a top performer, why hold it through the down period? We can see that today marked a climb back to top performer status after a year. The Relative Strength compared to the $SPX is shown in purple. This is trying to break out to six-month highs.
The price action broke out through the horizontal support/resistance shown in green. It also broke out to 2016 highs. The volume accelerated on the breakout and the MACD is now at its highest reading since April of 2015.
Autonation (AN) is testing the breakout level for new 2016 highs as well. This could be a clue for the Auto manufacturers. I covered off the Auto Manufacturer charts as part of the Commodity Countdown Webinar 2016-07-21. Click to watch the archive.
Have a good weekend.
Good trading,
Greg Schnell, CMT, MFTA.


