Chart Industries (GTLS) was mired in a downtrend for two years, shedding 90% of its market value, but things have changed and the upward momentum is quickly building for this equipment maker for the energy sector. They blew top and bottom line estimates out of the water and shareholders are finally being rewarded. Take a look at today's candle:
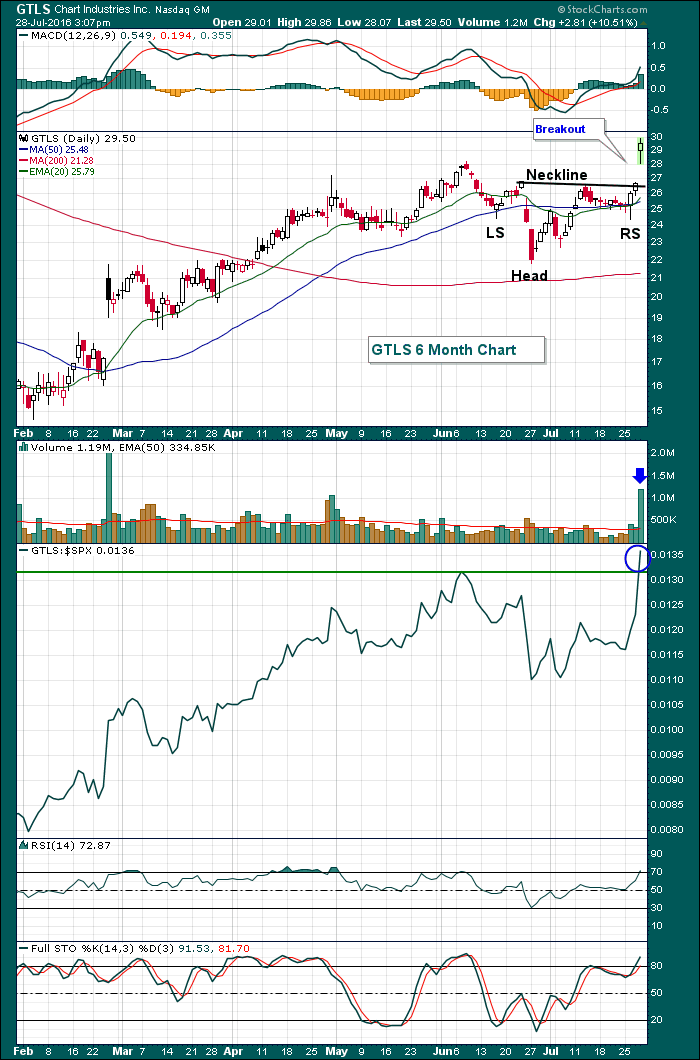 This inverse head & shoulders pattern initially measures to 31.50-32.00 but considering this was once a $130 stock, it's easy to assume that GTLS has much further upside available. The daily MACD looks very strong right now and that suggests that the next 20 day EMA test would represent a solid reward to risk entry. The neckline should also provide price support as well.
Happy trading!
Tom

About the author:
Tom Bowley is the Chief Market Strategist of EarningsBeats.com, a company providing a research and educational platform for both investment professionals and individual investors. Tom writes a comprehensive Daily Market Report (DMR), providing guidance to EB.com members every day that the stock market is open. Tom has contributed technical expertise here at StockCharts.com since 2006 and has a fundamental background in public accounting as well, blending a unique skill set to approach the U.S. stock market.
Learn More