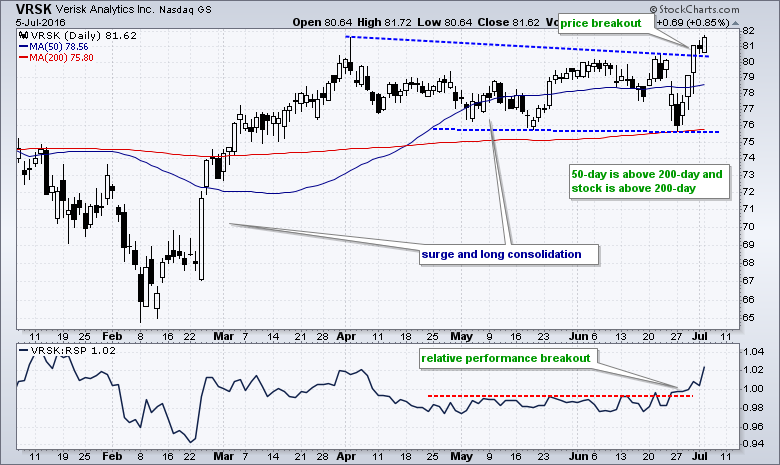
Verisk (VRSK) was not immune to the volatility of the last two weeks, but the stock held up well during the dip and outperformed during the bounce. First, notice that the stock ultimately held the mid May low and 200-day SMA during the late June dip. Second, notice that the stock exceeded the 22-June high with the surge over the last five days. Stocks and ETFs trading above their June highs right now show relative "chart" strength.
The overall pattern and two key moving averages also point to an uptrend. First, the stock surged from early February to early April and then consolidated with an extended trading range. VRSK then broke out of this range and this breakout signals a continuation of the prior advance. Second, the 50-day moving average is above the 200-day moving average, and the stock is above both moving averages. We can also throw in a relative performance breakout as the price relative (VRSK:RSP ratio) broke out over the last two weeks.
****************************************
Thanks for tuning in and have a great day!
--Arthur Hill CMT
Plan your Trade and Trade your Plan
*****************************************

