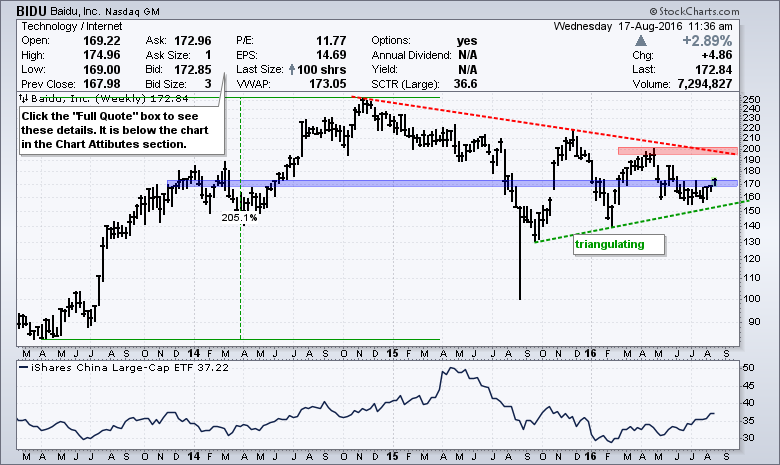
Baidu ($BIDU) has basically gone nowhere since 2014, but the stock is showing signs of buying pressure recently with a wedge breakout. First, the weekly chart shows the stock surging some 200% and moving above 170 for the first time in late 2013. The stock peaked in late 2014 and then fell sharply in 2015. A triangle then formed over the last 9-12 months as the stock battled the 170 area (blue shading). The red zone marks long-term resistance. We will look at the daily chart after the jump.
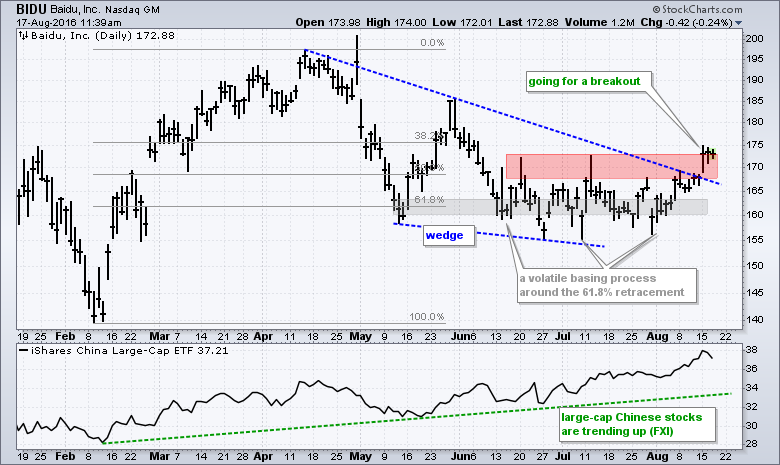
The next chart shows price action over the last seven months. BIDU surged and fell back with a falling wedge. Notice that the stock managed to firm around the 61.8% mark. There is nothing magical about this Fibonacci level, but it jibes with basic Dow Theory. How? A correction (secondary move) after an advance (primary move) is expected to retrace 1/3 to 2/3 of the prior move. BIDU clearly firmed in the 160 area and made a breakout bid with the surge over the last few weeks.
****************************************
Thanks for tuning in and have a great day!
--Arthur Hill CMT
Plan your Trade and Trade your Plan
*****************************************


