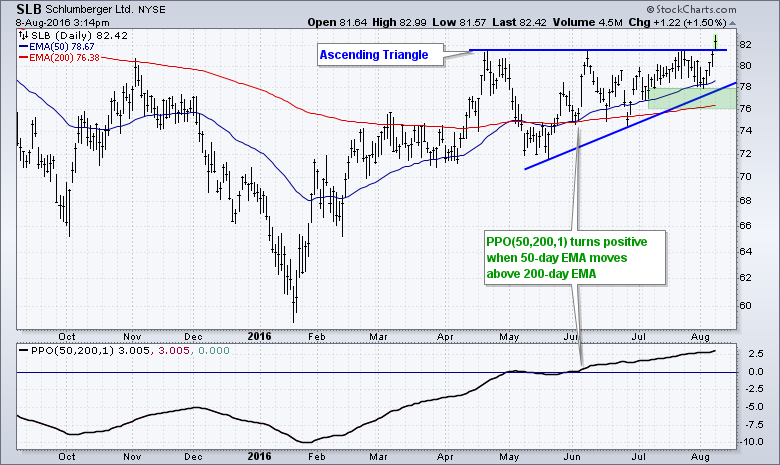
Schlumberger (SLB) broke above resistance today and this breakout confirms a bullish ascending triangle. First, note that the bigger trend is up because the 50-day EMA is above the 200-day EMA. Chartists can also plot this difference using the Percentage Price Oscillator (50,200,1), which is shown in the indicator window. Notice how it turned positive as the 50-day crossed the 200-day in early June. On the price chart, the ascending triangle formed from mid April to early August. The equal highs mark horizontal resistance and the higher lows reflect buying pressure coming in a higher price points. This is a bullish continuation pattern that is confirmed with a resistance breakout. With today's breakout, the upside target is around 92. The height of the pattern (82 - 72) is added to the breakout area for an upside target. Take this target with a grain of salt and watch the trend carefully. I would mark support in the 76-78 area and stay bullish as long as 76 holds.
****************************************
Thanks for tuning in and have a great day!
--Arthur Hill CMT
Plan your Trade and Trade your Plan
*****************************************


