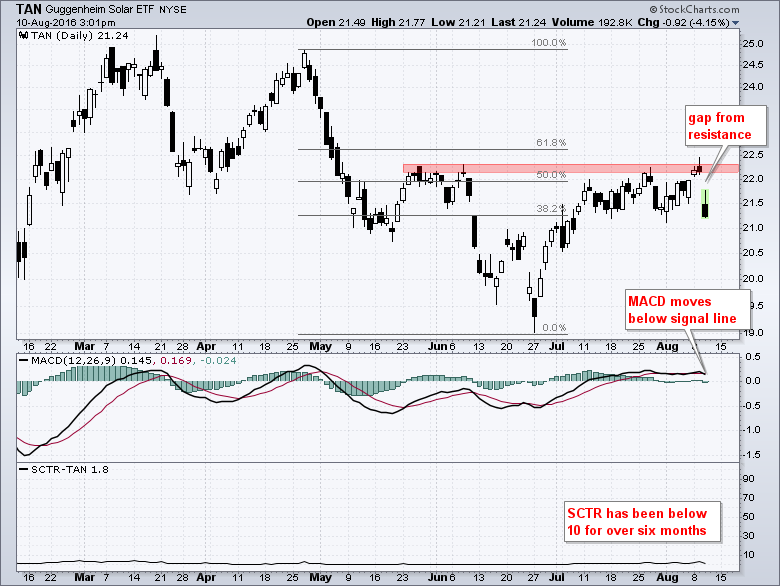
The Solar Energy ETF (TAN) got a nice bounce along with the stock market from late June to early August, but this bounce has now reversed and it looks like the bigger downtrend is resuming. The chart shows the highs from late May and early June marking resistance in the 22.25 area. This area also coincides with the 50-62% retracement zone, which is a typical retracement amount for a counter-trend rally (correction). Resistance has clearly held as the ETF gapped down on Wednesday and it looks like the long-term downtrend is resuming. Note that TAN hit a 52-week low in late June and the SCTR has been below 10 for over six months.
 ****************************************
Thanks for tuning in and have a great day!
--Arthur Hill CMT
Plan your Trade and Trade your Plan
*****************************************


