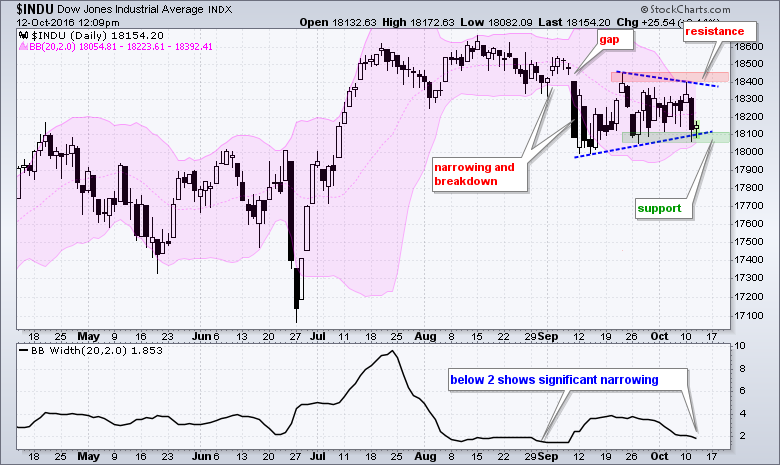
The Dow Industrials remains locked in a trading range since the 11-Sept breakdown and chartists should watch this range for the next directional clue. The chart shows the Bollinger Bands in pink and the indicator window shows BandWidth. A move below 2 shows a significant narrowing of the bands and we saw that in August-September and again in October. It is as if the Dow moved from one consolidation to another. This did indeed happen as the Dow broke down with a sharp decline on 11-Sept and this break remains the active signal on the daily chart. Even though the senior Average immediately firmed, it has yet to fill the 11-Sept gap to negate this signal.
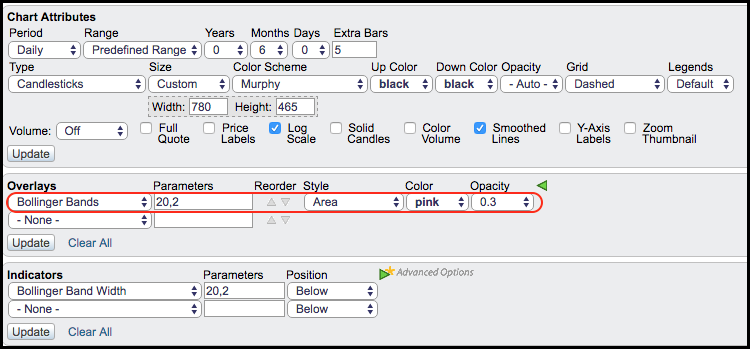
The recent range narrowed as a triangle formed on the price chart and BandWidth dipped below 2 again. This means the Dow could be gearing up for its next move. John Bollinger theorized that volatility expansions follow volatility contractions and this means we should expect a move relatively soon. Bollinger Bands do not, however, provide any directional clues so we must rely on the chart. The green zone marks support and the red zone marks resistance. Watch these levels for a break to resolve this triangle and trigger the next directional signal. The image below shows the SharpCharts settings for creating this chart.

****************************************
Thanks for tuning in and have a great day!
--Arthur Hill CMT
Plan your Trade and Trade your Plan
*****************************************

