There are basic technical analysis 101 principles and perhaps none more significant than the premise of price support and price resistance. During an uptrend, think of support and resistance as you would traveling higher in an elevator in an office building. The ceiling (resistance) on the first level becomes the floor (support) on the second. Many times, price will travel above earlier highs (resistance) - and if it happens on nice volume, I expect that earlier price resistance to become price support. As you can see below, Charter Communications (CHTR) broke above earlier price resistance in August at 244 and at the end of this past week, buyers emerged as it tested that 244 support. Check it out:
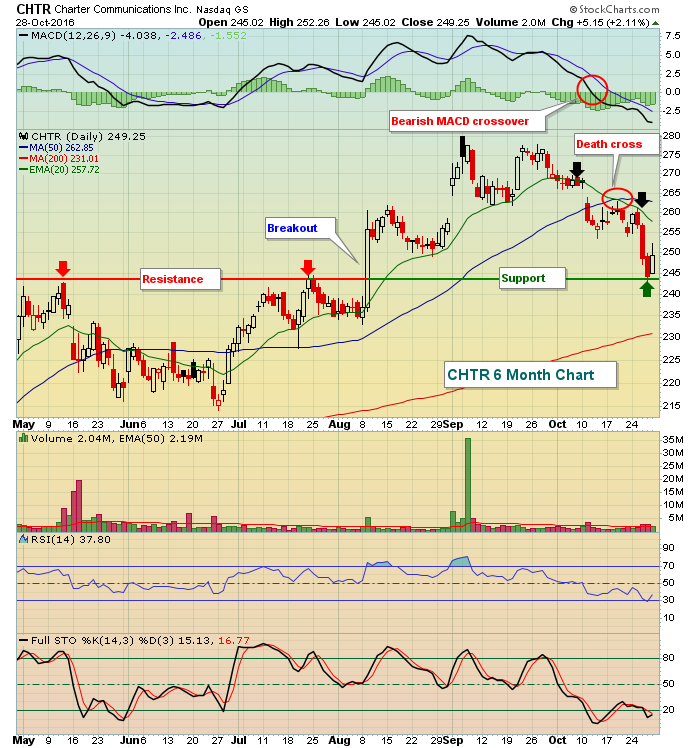 The red arrows mark price resistance near 244. Once that level was broken on increasing volume, 244 became price support. It took more than two months to return to that level, but CHTR bounced on Friday as soon as 244 was reached. The bulls have issues now too though. Note recently the bearish MACD crossover, bearish death cross (20 day EMA moving beneath 50 day SMA) and failure after a test of the declining 20 day EMA (black arrow). I expect that the uptrend will continue now that we've seen the price support test, but the first obstacle will be clearing the 20 day EMA.
Happy trading!
Tom


