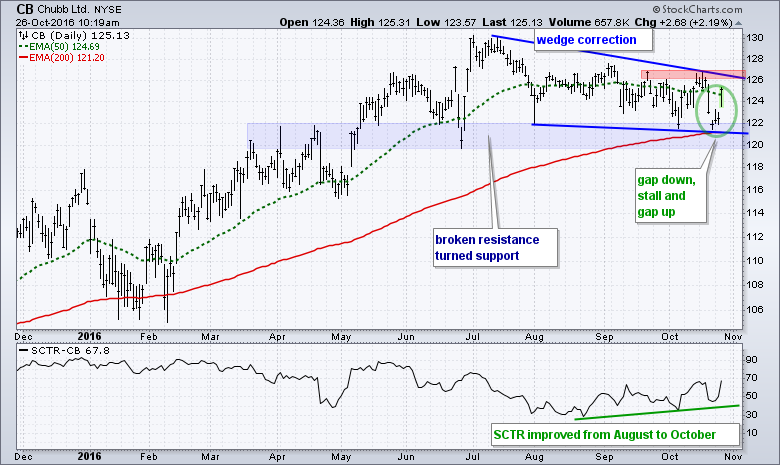
Chubb trended lower from July to October, but a gap-laden reversal off a big support zone suggests that this decline may be reversing. More importantly, this decline looks like a correction with a bigger uptrend. Let's look at the evidence for a long-term uptrend. First, Chubb (CB) hit a 52-week high with the June surge. Second the 50-day EMA is above the 200-day EMA. Third, the stock is above the rising 200-day EMA. These indications point to a long-term uptrend.
Assuming the long-term trend is up, the decline from 130 to 122 (~6.5%) should be viewed as a correction within this bigger uptrend. Note that this decline is relatively modest compared to the prior advance, which extended from 106 to 130 (~22.5%). Moreover, the falling wedge is a typical pattern for a correction within bigger uptrend.
There are signs this correction is ending because the stock held support in the 120-122 area and held the 200-day EMA. Notice how the stock gapped down on October 20th, stalled for three days and then gapped up. This amounts to a short-term reversal that reinforces support. A break above the October high is the next step to a full reversal of the falling wedge.
****************************************
Thanks for tuning in and have a great day!
--Arthur Hill CMT
Plan your Trade and Trade your Plan
*****************************************


