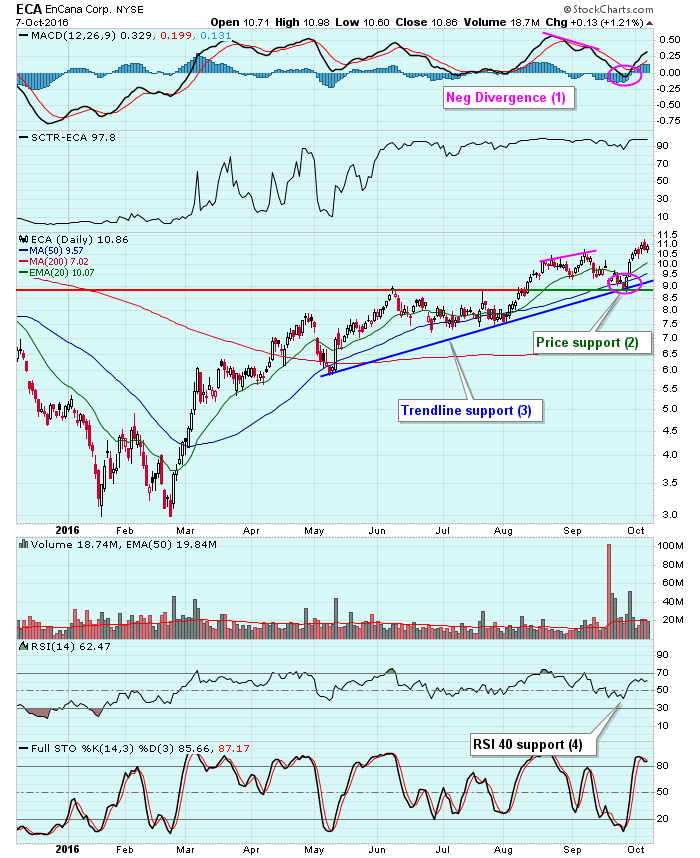
There is no such thing as a guarantee when it comes to stock trading. However, using technical analysis as a predictive tool to manage your risk is the key to success in my opinion. Let's take EnCana Corp (ECA) as an example. ECA lost more than 15% over a three week period in September, but it set up a very solid reward to risk trade where multiple buy signals triggered simultaneously. Below is a chart that identifies four separate technical reasons to buy ECA:
 First, a negative divergence printed on the early September high and that generally signals slowing momentum and suggests to wait for a 50 day SMA test (and typically a MACD centerline reset). The 50 day test and centerline reset are both highlighted with pink circles. Second, price support just beneath 9.00 was established when price action cleared prior resistance at that level in the second week of August. Third, lows in May and August had established an uptrend line that was also being tested when ECA's price dipped below 9.00. Finally, I'm a huge fan of buying uptrending stocks on pullbacks where the RSI falls back near the 40 level. Notice throughout ECA's uptrend, the stock price has recovered shortly after RSI hit or approached 40. One last point: ECA has had a SCTR rank of between 80 and 100 for more than four months now. Clearly, this is a stock in favor so buying on dips so long as the uptrend remains intact would seem to make good technical sense.
Happy trading!
Tom
