The rise in Treasury yields and bullish fourth quarter provide a strong tail-wind for banking stocks as we head into year-end. After experiencing a wicked whipsaw in June from the Brexit vote, the Regional Bank SPDR (KRE) surged in early July and resumed an uptrend that began with the February reversal. KRE surged to 43 in August and then formed a falling flag into September. Note that a falling flag is a bullish continuation pattern and the flag breakout signals a continuation of the July-August surge. I would now mark support in the 40-41 zone and expect higher prices as long as this uptrend and support zone hold.
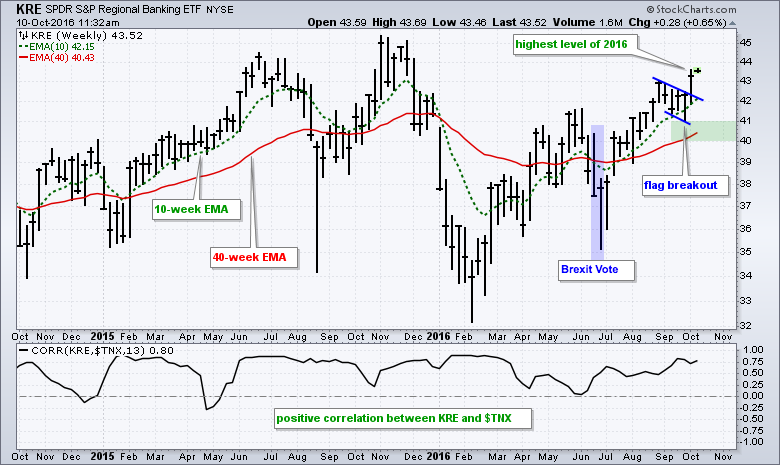
The indicator window shows the 13-week Correlation Coefficient (KRE,$TNX) spending most of its time in positive territory. This means that the 10-yr Yield and KRE tend to move in the same direction (positive correlation). This also means we should watch the 10-yr Yield for clues on banking stocks.
The second chart shows the 10-yr T-Yield moving from the 1.4% area in late June to the 1.75% area last week. This sharp rise facilitated the July-August surge and flag breakout in the Regional Bank SPDR. Even though one could make the case for a long-term downtrend in the 10-yr yield, the green lines mark a rising channel since July and this is the trend to watch. The lower trend line and last week's low set the key level at 1.6% (16 on the chart). A move below 1.6% would undo last week's big surge and break channel support. This would be most negative for banks and call for a re-evaluation.
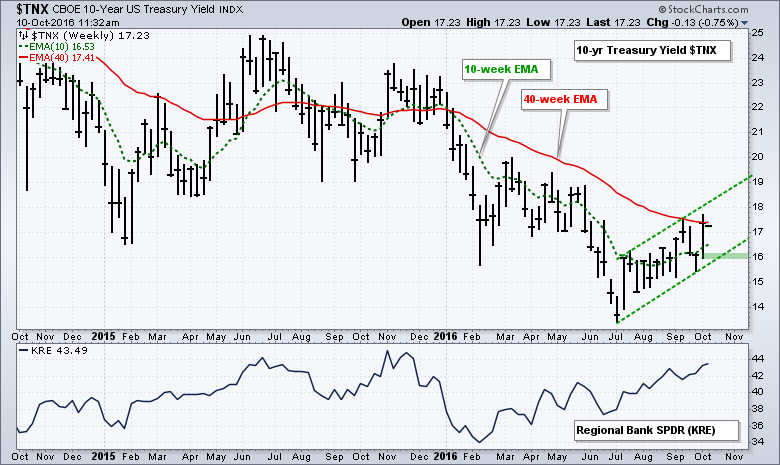 Bottom Line: The Regional Bank SPDR and S&P 500 are in clear uptrends because their 10-week EMAs are above their 40-week EMAs. In addition, the 10-yr Yield is in an immediate uptrend and the six-month seasonal pattern is poised to turn bullish for stocks. The combination points to higher prices for the banking stocks and bank-related ETFs in the fourth quarter.
Note: I wrote a detailed article testing the Best Six Months strategy and adding MACD for timing. This article is available to StockCharts to members only.
****************************************
Thanks for tuning in and have a great day!
--Arthur Hill CMT
Plan your Trade and Trade your Plan
*****************************************


