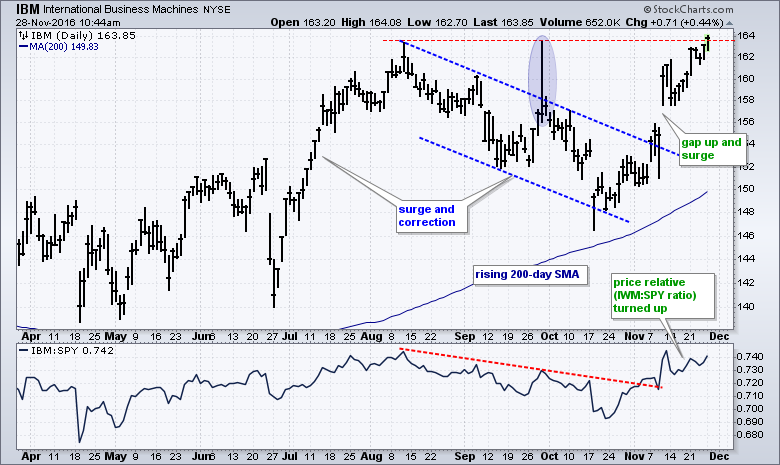
Even though its bell-weather status diminished over the years, IBM is still a big blue chip stock and remains a titan in the technology sector. Thus, a 52-week high in IBM bodes well for the market overall and the tech sector. The chart below shows IBM surging with the market from late June to early August and then correcting with a pullback into early November. I drew a falling channel to define this correction and decided on an internal trend line for the upper trend line. An internal trend line cuts through a spike low or high, such as the 29-Sept spike above 163 (blue oval).
IBM exceeded the channel trend line with a surge on November 7th and then gapped up on November 10th. This gap looks like a breakaway gap that shows strong buying pressure. IBM moved above its August-September highs in early trading on Monday and recorded a 52-week high. Chartists may be concerned that the stock and the S&P 500 are short-term overbought after big runs the last three weeks. That may indeed be the case, but 52-week highs are long-term bullish and they are usually not isolated events. This means we should expect more 52-week highs in the coming months and put IBM on our watchlist for bullish setups (pullbacks).
****************************************
Thanks for tuning in and have a great day!
--Arthur Hill CMT
Plan your Trade and Trade your Plan
*****************************************


