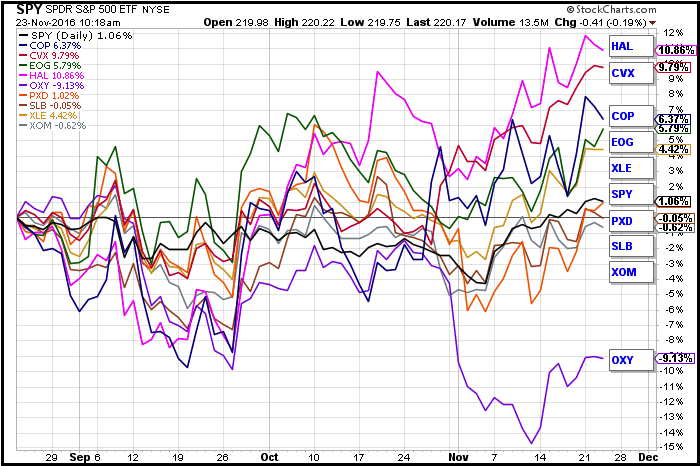
The Energy SPDR (XLE) hit a new 52-week high this week, but its largest component, Exxon Mobil (XOM) remains well below its summer high and is not participating. The second biggest component, Chevron (CVX), is leading the charge with a 6+ percent advance in November and a 52-week high. Note that XOM accounts for 16.82% of XLE and CVX weighs in at 14.78%. The performance SharpChart below shows performance for XLE, SPY and the top eight stocks over the last three months. HAL, CVX and COP are the leaders. SLB, XOM and OXY are the laggards.
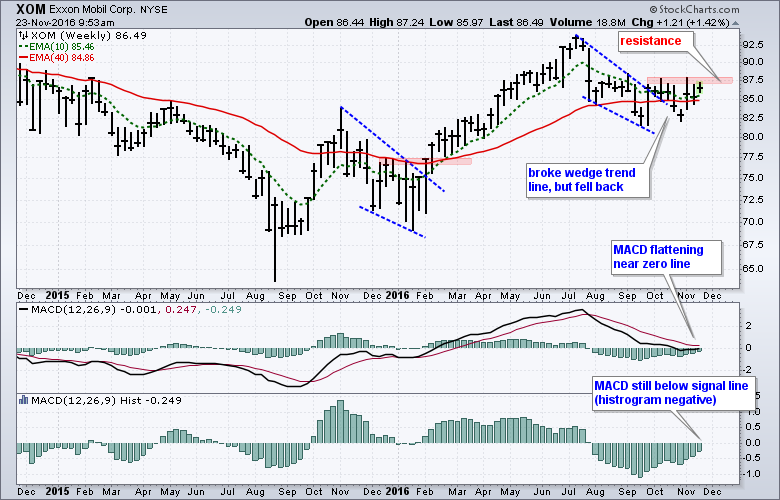
Despite relative weakness over the last few months, I am watching XOM because weekly MACD flattened over the last few weeks and could be poised for an upturn. Let's first look at the price chart. XOM surged from August to October 2015, pulled back with a wedge into January 2016 and broke out in February. This breakout set the stage for an extended advance and 52-week highs in June-July. The stock then pulled back with another falling wedge and broke the upper trend line with a surge in late September. This surge met resistance in the 88 area and a follow-through breakout is needed to put XOM back on the bullish track.
 The indicator windows show weekly MACD and the MACD Histogram. MACD is the difference between two EMAs (12-week and 26-week). The MACD Histogram is the difference between MACD and its signal line, which is the 9-week EMA of MACD. Notice that MACD flattened near the zero line the last few weeks as momentum turned neutral. MACD remains below its signal line and I am watching for an upturn, which would be bullish. Chartists can also watch the MACD Histogram for a potential upturn. A move above the zero line would mean that MACD moved above its signal line.
Happy Thanksgiving!!
****************************************
Thanks for tuning in and have a great day!
--Arthur Hill CMT
Plan your Trade and Trade your Plan
*****************************************


