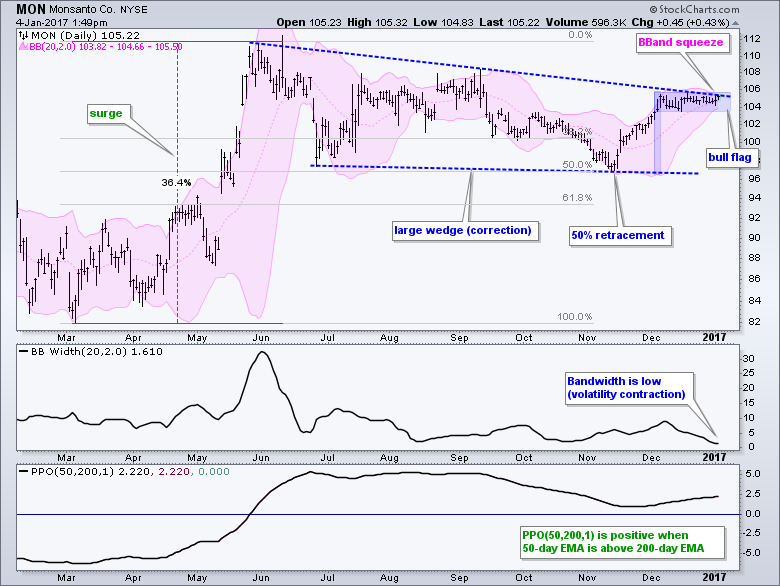
Monsanto (MON) is in the midst of a tight consolidation and the resolution of this consolidation could trigger a big breakout. Let's first start with the bigger picture. MON surged 36.4% from March to June and then corrected with a large wedge. The low of this wedge marks a 50% retracement of the prior advance. Thus, it looks like the surge represents two steps forward and the wedge represents one step backward. The pattern and the retracement amount are typical for corrections and the stock is now challenging the upper trend line.
The pink area shows the Bollinger Bands contracting and the indicator window shows BandWidth at its lowest level in over a year. This is a serious volatility contraction that could give way to a volatility expansion (big price move). Even though Bollinger Bands do not give us any direction clues, I think the odds favor an upside breakout for three reasons. First, the bigger trend is up because the 50-day EMA is above the 200-day EMA (PPO is positive). Second, it looks like a bull flag formed in December and this is a bullish continuation pattern. Third, we are in a bull market and this favors bullish resolutions to chart patterns. A breakout at 106 would be quite bullish and argue for a move above last year's high.
****************************************
Thanks for tuning in and have a great day!
--Arthur Hill CMT
Plan your Trade and Trade your Plan
****************************************


