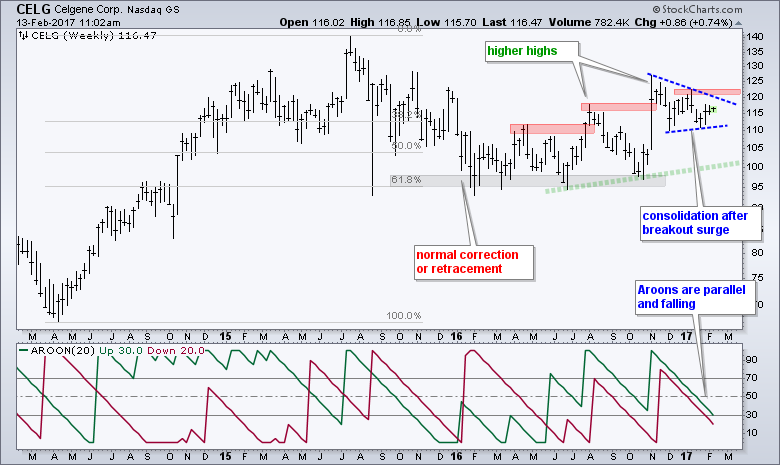
Celgene (CELG) has not made much headway the last twelve months, but the overall trend is up and the current consolidation looks like a bullish continuation pattern. Taking a step back, notice that CELG doubled from the April 2014 low to the July 2015 high (~70 to ~140). The stock then retraced around 61.18% of this advance with a 30+ percent decline into January 2016. Even though a 30+ percent decline seems long-term bearish, the retracement amount is actually normal for a pullback within an uptrend. Signs of a long-term uptrend are emerging as the stock bounced off the 95-100 area four times from January to October, and forged higher highs in August and November.
The stock is currently stuck in a consolidation that looks like a bullish continuation pattern. After surging above 125 in November, the stock stalled the last three months with a triangle-wedge formation. These are typically continuation patterns that represent a rest after a big move. Their directional bias is based on the prior move and that move was up. A break above the January high would signal an end to this corrective period and a resumption of the uptrend. Chartists can also watch the Aroon indicators for a signal. Notice that both Aroons are parallel and falling the last two months. The first one to turn up and break above 50 would provide a directional signal for Celgene.
****************************************
Thanks for tuning in and have a great day!
--Arthur Hill CMT
Plan your Trade and Trade your Plan
****************************************

