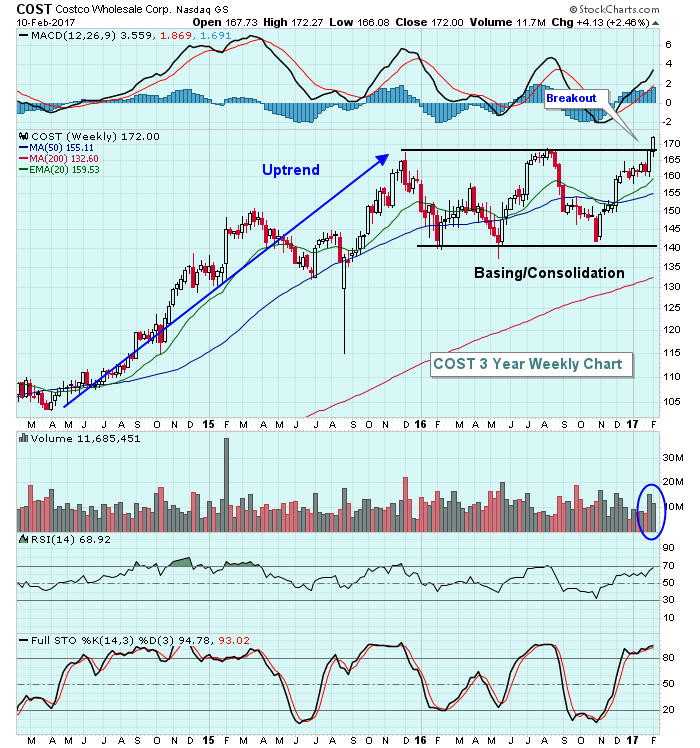
After long basing periods, breakouts can be very significant technical events that lead to powerful gains. Those invested in or trading Costco (COST) are hoping last week's breakout signals a nice advance in the months ahead. Three months ago, COST bulls successfully defended key price support and the rally that ensued finally broke major price resistance. Check out the chart:
 The last two weeks did see increasing volume to confirm this latest move higher. The two key levels of support are now price support near 169 and the rising 20 week EMA, currently at 159.53. Seasonally, February and March have been decent months for COST over the past 20 years so historical performance shouldn't be a hindrance at all.
Happy trading!
Tom


