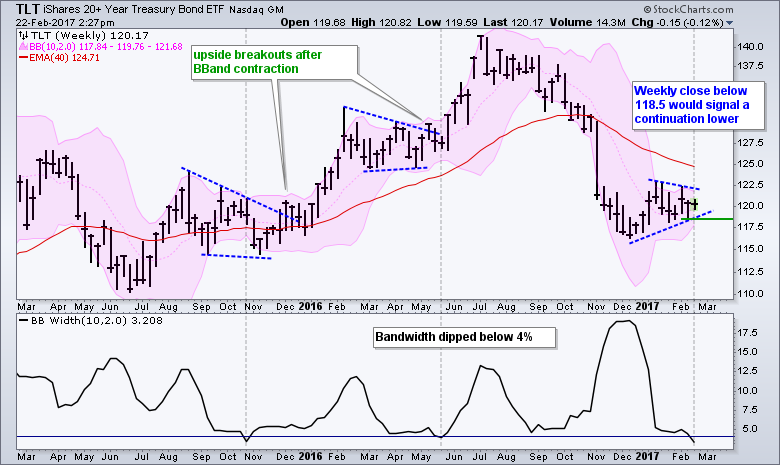
The 20+ YR T-Bond ETF (TLT) is consolidating within a long-term downtrend and this favors a bearish resolution to the current pattern. TLT fell sharply from July to November and broke through its 40-week EMA. The ETF is currently consolidating below the falling EMA and a consolidation within a downtrend is a bearish continuation pattern. The blue trend lines mark a triangle formation and chartists can watch this pattern for a break. A weekly close below 118.5 would break triangle support and signal a continuation lower. Another leg down in TLT would imply another leg up in long-term Treasury yields.
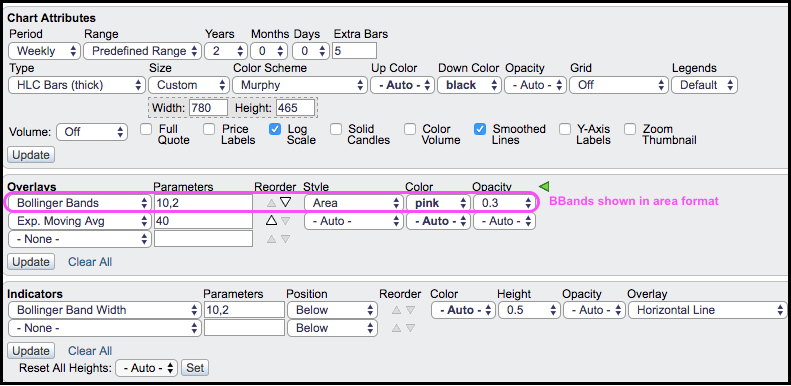
The magenta area on the price chart marks the Bollinger Bands (10,2). Volatility within the consolidation is decreasing because the Bollinger Bands are contracting. We can measure contraction by using the BandWidth indicator, which fell below 4% for the third time in two years. The gray dashed lines mark the last two times BandWidth dipped below 4%. Notice that these occurred during consolidations on the way up. We are now consolidating on the way down and this favors a downside break. Breaks don't always go in the direction we expect so chartists should also watch 122.5 for an upside breakout in the long bond ETF.
****************************************
Thanks for tuning in and have a great day!
--Arthur Hill CMT
Plan your Trade and Trade your Plan
****************************************


