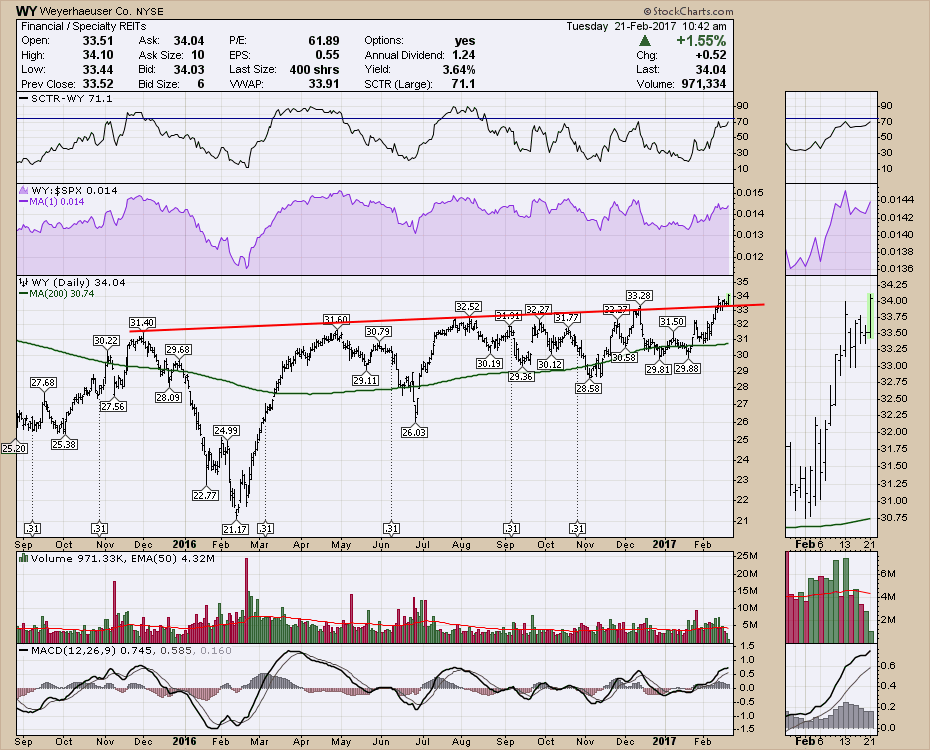
Every week on the Commodities Countdown recording, we look at lumber prices. For the last week $LUMBER has pushed up and the lumber stocks are all on a big broad push. Weyerhaeuser (WY) is pushing through the previous highs or the forest canopy if you will.
One thing supporting is the huge volume as the stock is breaking out. You can see it clearly on the zoom panel on the right. The rest of the week had light volume as the stock consolidated. However, this does appear to be well supported by a lot of other forestry stocks joining the surge.
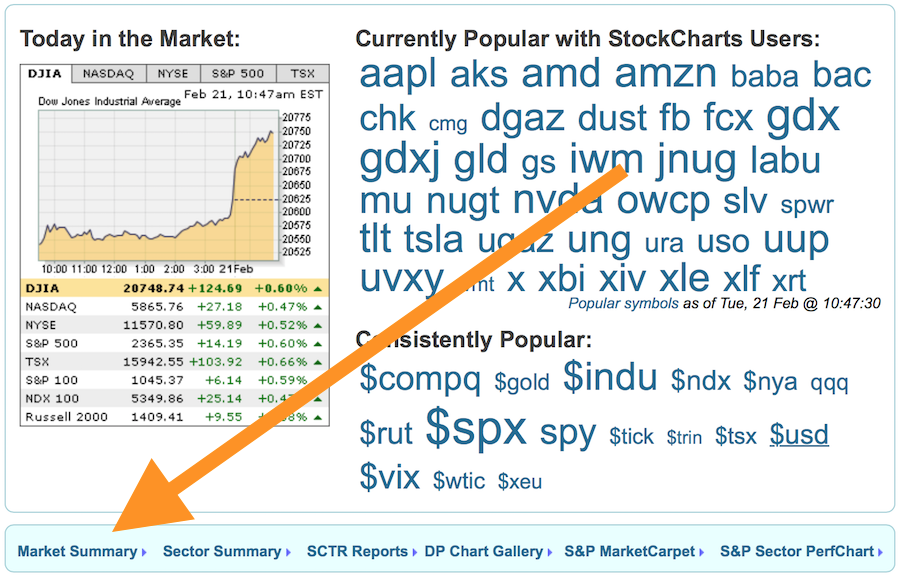
For my educational segment, I would like to make sure everyone knows where the Market Summary is to start their day every day.
The Market Summary is found on the highlighted line immediately below the Home Page chart and the active tickers.
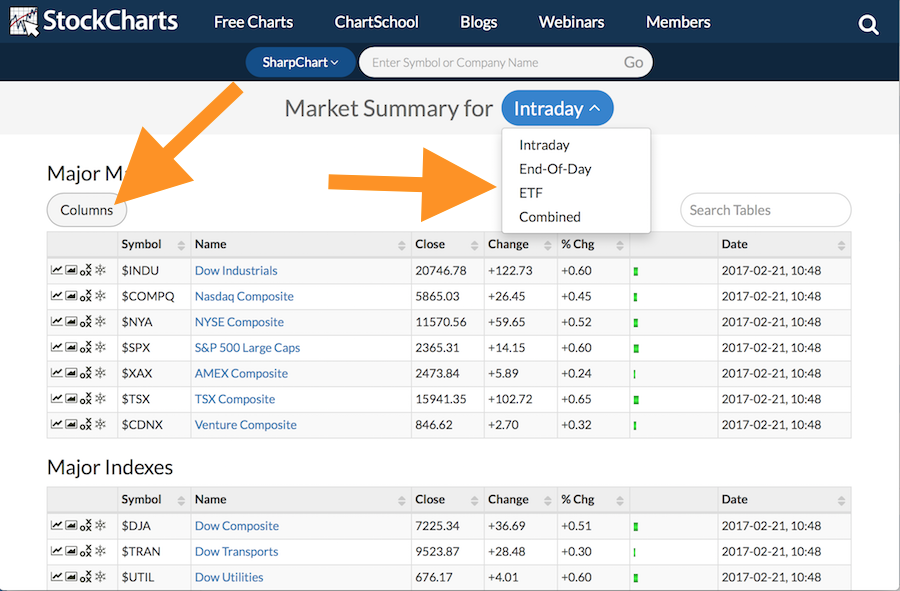
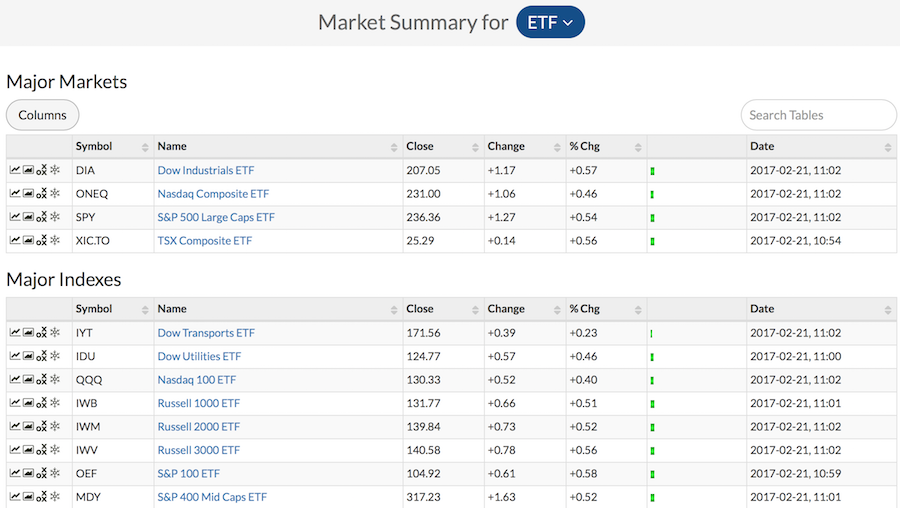
 A quick click gets puts you on an outstanding page that sorts out the markets for you. There are a few variables that you can change. One particular one is using the ETF on the dropdown menu. This lists ETF's that are moving making in more investable rather than having an index that is only an index and can't be bought. As an example, SPY will be where the $SPX is.
 On that page you will find the market broken down into different groups.
- Major North American Markets
- Major US Indexes
- Sector SPDR's
- US Industry Indexes
- International ETF's
- US Bonds
- US Commodities
- Currencies
- Market Breadth
You will also find a small box at the bottom to take you to the McClellan Summation Indexes and Bullish Percent Indexes.
 Here is an example of the page converted to ETF display.
 Over the weekend, the StockCharts.com ChartWatchers email article came out with lots of different perspectives. If you have not had a chance to read it, you can follow this link to the ChartWatchers Blog tab and find the various articles there.
StockCharts is now offering a free one-month trial for new members. If you would like to become a member and join thousands who look to StockCharts.com for award winning Technical Analysis commentary, tools, and education, click this link to see our various very low cost offerings.
I will be recording my market views and posting them as part of my commentary blog articles rather than live webinars. Check my blog pages or subscribe at the bottom to be notified when new articles or recordings appear. The Commodities Countdown blog, The Canadian Technician blog, Chartwatchers, Don't Ignore This Chart.
Good trading,
Greg Schnell, CMT, MFTA.

