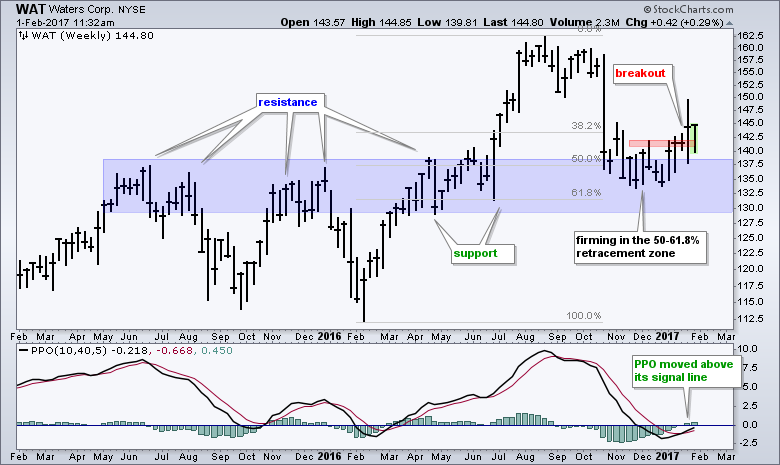
Waters Corp (WAT) was hit hard with a double-digit decline in October, but the stock ultimately firmed in November-December and turned up in 2017. Waters Corp is in the top 20% of S&P 500 stocks for year-to-date gain. The chart also looks rather promising. Even though the October decline was rather dramatic, notice that the stock found support in a logical area. First, resistance levels from June-2015 to April 2016 and support levels from April 2016 to June 2016 combined to mark a big support zone in the 130-138 area. Second, the decline retraced 50-61.8% of the prior advance, was over 40% (February 2016 to August 2016). Thus, it still looks like two steps forward and one step backward for this stocks (long-term uptrend). Most recently, the stock firmed for a couple of months and broke its first resistance level with a move above 142.5 the last two weeks.
The indicator window shows the PPO(10,40,5) turning up over the last few weeks and moving above its signal line. This PPO measures the percentage difference between the 10-week EMA and the 40-week EMA. It is just below zero and this means the 10-week EMA is still below the 40-week EMA. A move into positive territory would signal a bullish EMA cross. Momentum is clearly improving because the PPO turned up and moved above its 5-period EMA (the red signal line). This is affirmed by the PPO histogram, which turned positive.
Benzinga Pre-Market Prep
Note that I will be on the Pre-Market Prep with Joel Elconin (@Spus) and Dennis Dick (@TripleDTrader).
Tune in here on Friday morning at 8:30 AM EST.
****************************************
Thanks for tuning in and have a great day!
--Arthur Hill CMT
Plan your Trade and Trade your Plan
*****************************************


