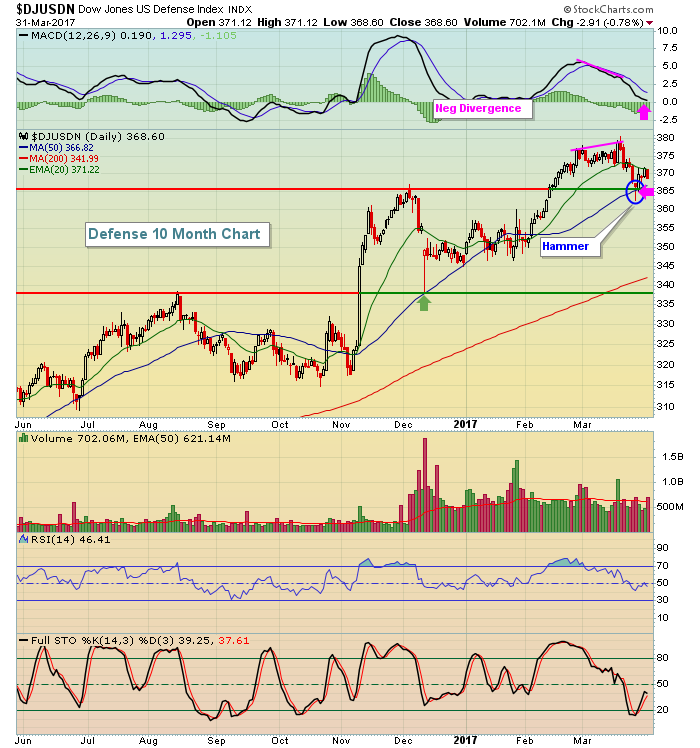
Bullish rotation continues in most areas of the market and we saw a perfect example of that last week in the Dow Jones U.S. Defense Index ($DJUSDN). The DJUSDN had a HUGE month in February, gaining roughly 6.5% in that month alone. That swamped the benchmark S&P 500, which gained 3.7% in February. The problem, however, is that early March price high was a struggle and accompanied by a negative divergence. Take a look:
 The low in December shows a beautiful bounce off price support and truly represents Technical Analysis 101 - prior price resistance becomes price support (green arrow). Fast forwarding to the latest breakout, you can see the negative divergence (pink lines - higher price, lower MACD) that emerged. This tells us that as price action moves higher, we're actually seeing the short-term 12 day EMA converge towards the longer-term 26 day EMA, representing slowing momentum. When this occurs, I look for the rising 20 day EMA to fail to hold as support and additional selling down to 50 day SMA support and potentially accompanied by a MACD centerline test (pink arrows above mark both). The DJUSDN printed a hammer on both price support and the 50 day SMA, marking a very significant support level as move forward. Notice also that both price lows - in December and March - occurred as the RSI neared 40 support.
I'm expecting to see defense stocks regain their leadership role in April.
Happy trading!
Tom


