Even though Vodafone remains in a long-term downtrend, the stock has been on my watch-list recently because it could be putting in bottom. Analysis of Vodafone and other ADRs is not straight-forward because there is a currency component. Usually, the movement of the stock is more than enough to compensate for any adverse currency movements, but the British Pound took a big hit in June and this adversely affected the stock. Today, I will first look at Vodafone in British Pounds (VOD.L) and then Vodafone in Dollars (VOD). I will then look at Cable (Pound-Dollar cross) and the British Pound ETF (FXB).
The chart below shows VOD.L trading around 200 pence, which is around 2 pounds. Don't worry, it is not a penny stock because lots of stocks in the UK are priced between 100 and 1000 pence (1 to 10 pounds). When possible chartists should analyze a security in the currency in which it is traded. This provides a cleaner picture for the supply-demand dynamics, trends and chart patterns. VOD.L could be forming a double bottom with resistance in the 215 area. A breakout here would confirm the pattern and target a move to the 240 area. Shorter-term, the stock surged to 215 in February-March and then retraced around 61.8% with the pullback to the 200 area. A higher low could be forming as the stock gapped up three days ago and this gap is holding. Note that Vodafone reports earnings on May 5th.
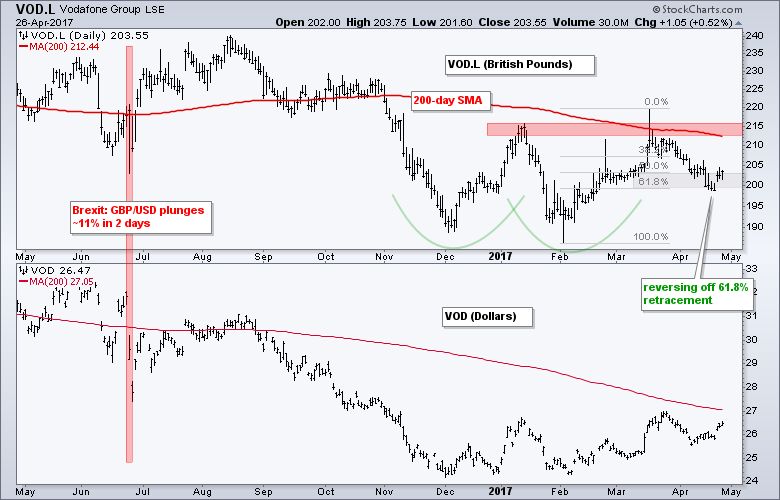
The lower window of the chart shows Vodafone in US Dollars. Notice how VOD plunged in June when $GBPUSD fell over 10% (red zone). Sudden currency moves can affect ADRs and ETFs with foreign assets. These shocks, however, are the exception, not the norm. In general, currency pairs are often more stable than the underlying stock and the Pound-Dollar pair is one of the most stable over the last six months.
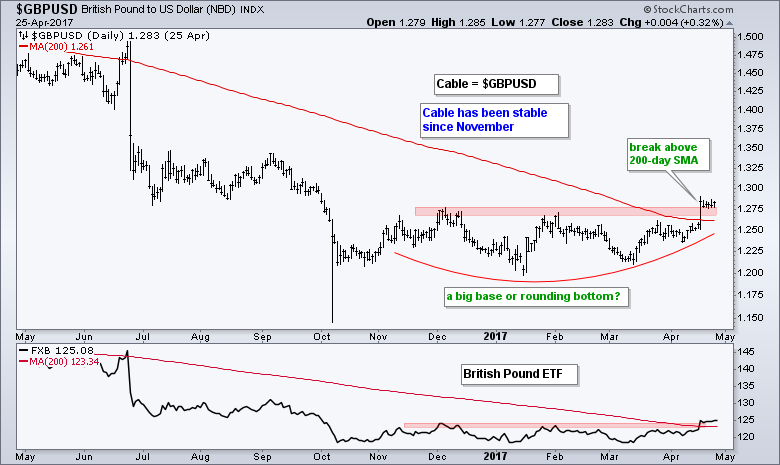
The next chart shows Cable, which is the classic term for Pound-Dollar ($GBPUSD). This term cable comes from the trans-Atlantic cable between the UK and the US, which was first laid in 1858. The chart shows Cable plunging in June, moving lower again in September and then flattening from October to March. Notice that this currency pair has been incredible stable the last six months. It is possible that a rounding bottom formed and Cable broke out with the surge in mid April. Also notice that Cable broke the 200-day SMA for the first time since June (pre-Brexit).
****************************************
Thanks for tuning in and have a great day!
--Arthur Hill CMT
Plan your Trade and Trade your Plan
*****************************************


