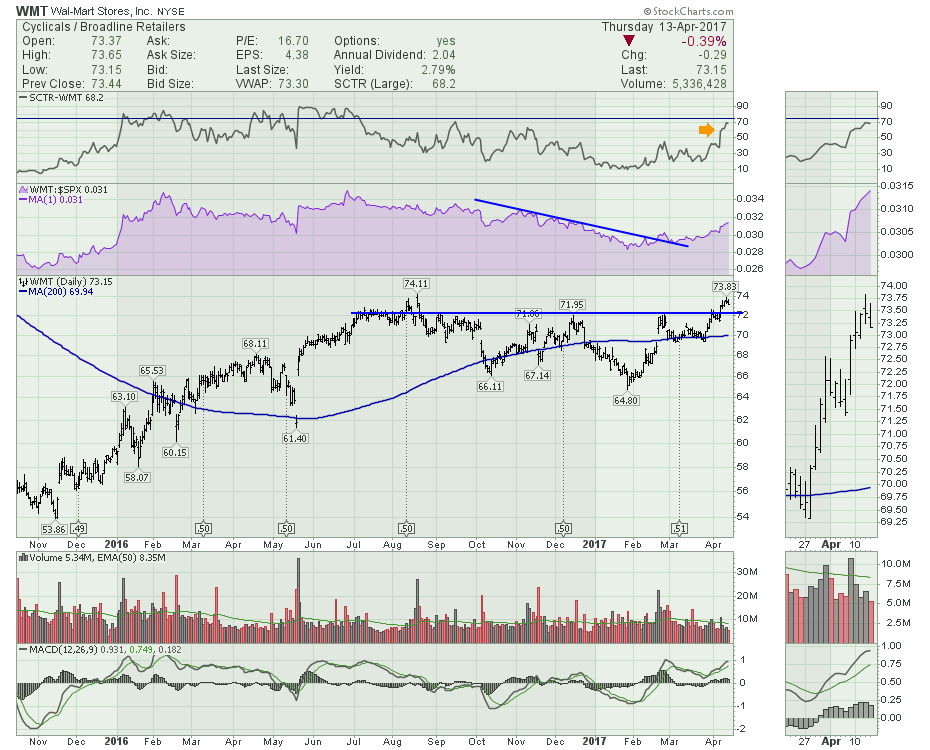
Wal-Mart (WMT) started ringing all kinds of alarm bells this week. Let's look at the chart, and then in the educational segment, I'll show some of the technical signals that Wal-Mart is marking.
Wal-Mart's SCTR has been rising recently. The price is trying to break out to new 52-week highs. This makes Wal-Mart interesting. The relative strength trend line broke in late February. The daily MACD moved up above the zero line. So I would always like a chart pattern like this.
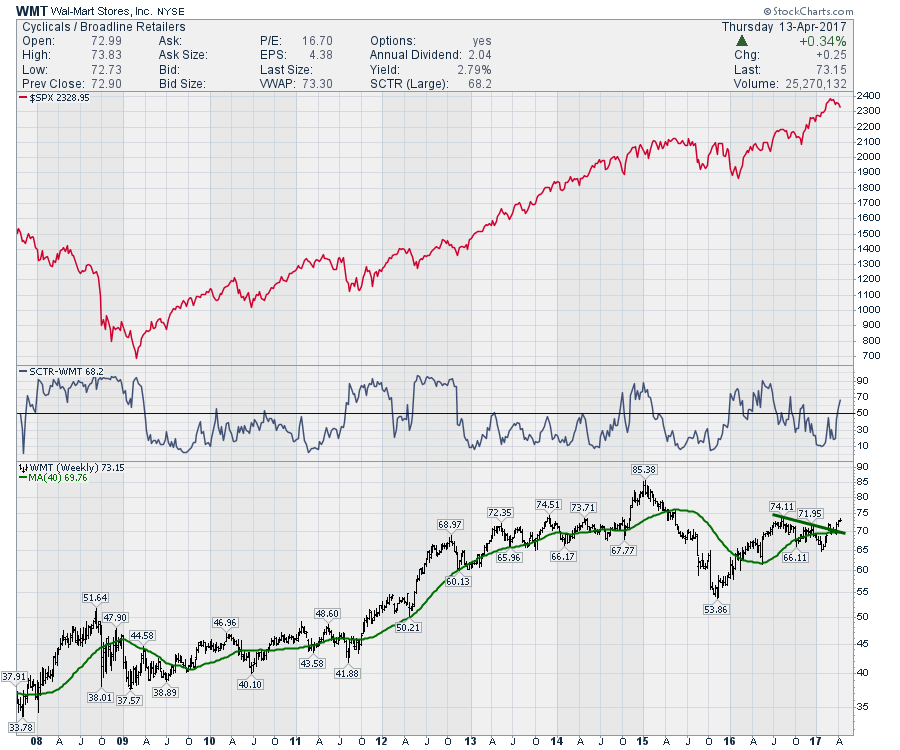
However, Wal-Mart is such a significant part of the US (world) economy, it possesses some different traits. While it is in the Consumer Discretionary Sector, Wal-Mart has also become a major grocer. It could easily be ranked as a Consumer Staple. If we just look at the price of Wal-Mart, the $SPX and the SCTR, it does not appear obvious, but there are some great clues here.
 However, if I shade some data, it makes it more obvious. When the overall market is struggling and people move to defensive stocks, Wal-Mart's SCTR ranking seems to move above 50. Wal-Mart was actually higher in 2008. In 2011-2012 the overall market wobbled. Wal-Mart performed very well while the $SPX started and finished that period at 1350. In 2013-2014 the FED had it's foot on the gas with QE infinity. Almost everything was soaring. Except Wal-Mart. Over a 2 year period is slowly oscillated higher but visited $67.50 almost every quarter which is where it was when the SCTR broke down and where it was when the SCTR broke back to the upside. Hardly a compelling ownership period.
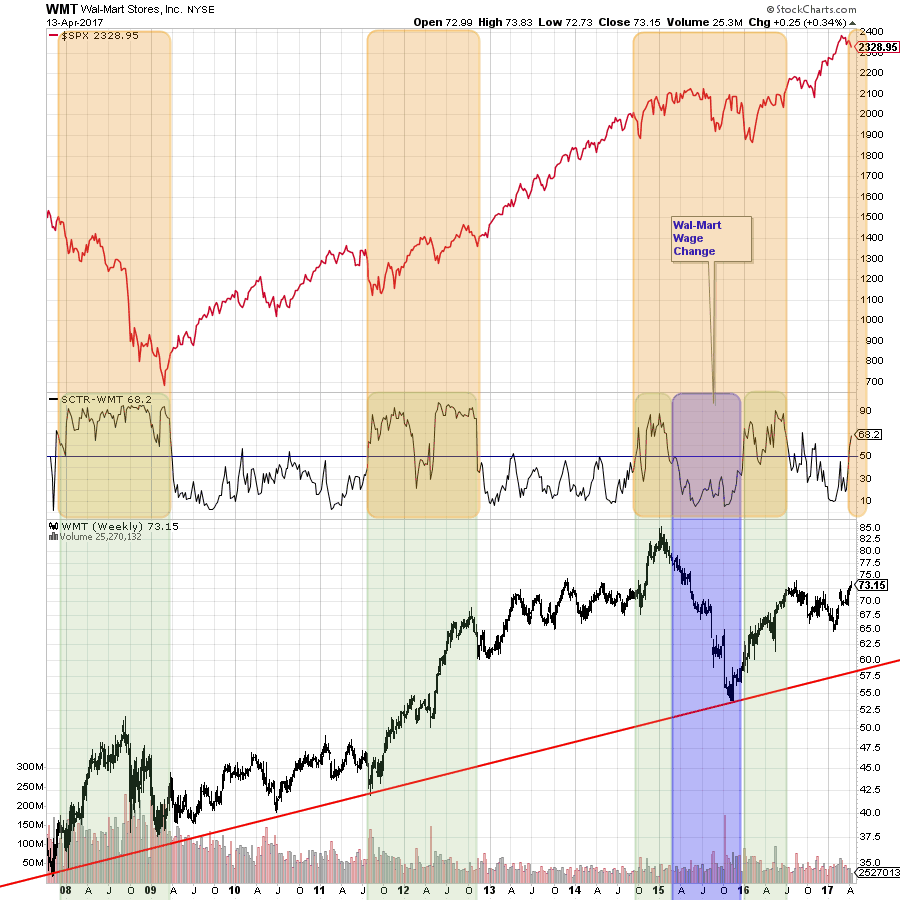 Staying with the chart above, the period around April 2015 was when Wal-Mart was under attack for paying low wages. When they announced the wage increase, the shares took a hit. So the SCTR fell. Here is a CBS article about the wage increases at Wal-Mart starting in April 2015. I have shaded it orange all the way across the 2015 year because the $SPX was flat, so it's a puzzle as to whether or not Wal-Mart would have had such a weak SCTR as well as the huge dip and rebound. That huge dip was very uncharacteristic of Wal-Mart's typical price action. Lastly, we can see Wal-Mart has recently accelerated higher with an SCTR above 50.
I discussed this relationship on the most recent Commodities Countdown 2017-04-13 video if you would like an audio commentary.
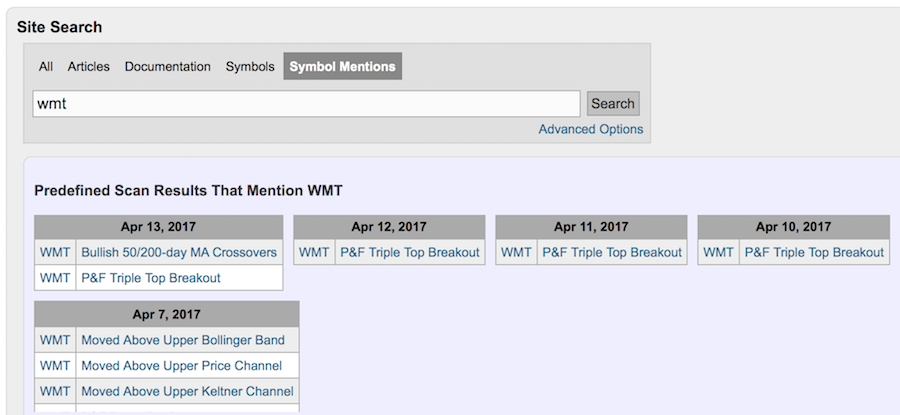
Moving onto the educational segment, the Search box on the home page of StockCharts.com is really helpful. If you type in WMT, it will tell you about all the commentary on the site about that particular ticker symbol. It will also tell you about the recent technical events that have happened on the stock. Here is an example.
 The market appears corrective here but it is already six weeks since the last high. With XLU and Wal-Mart sporting surging SCTR's, a defensive posture is setting up.
Good trading,
Greg Schnell, CMT, MFTA.


