Intel (INTC) has been trading in bullish sideways fashion since topping in October. The Dow Jones U.S. Semiconductor Index ($DJUSSC) has continued to rise and lead the benchmark S&P 500 on a relative basis - even while INTC consolidates. A breakout in Intel would measure to 42 based on its ascending triangle. That's a tidy profit from the current price of 35.53. Given the strength in its industry group, INTC could make a fairly quick push higher. Here's the chart:
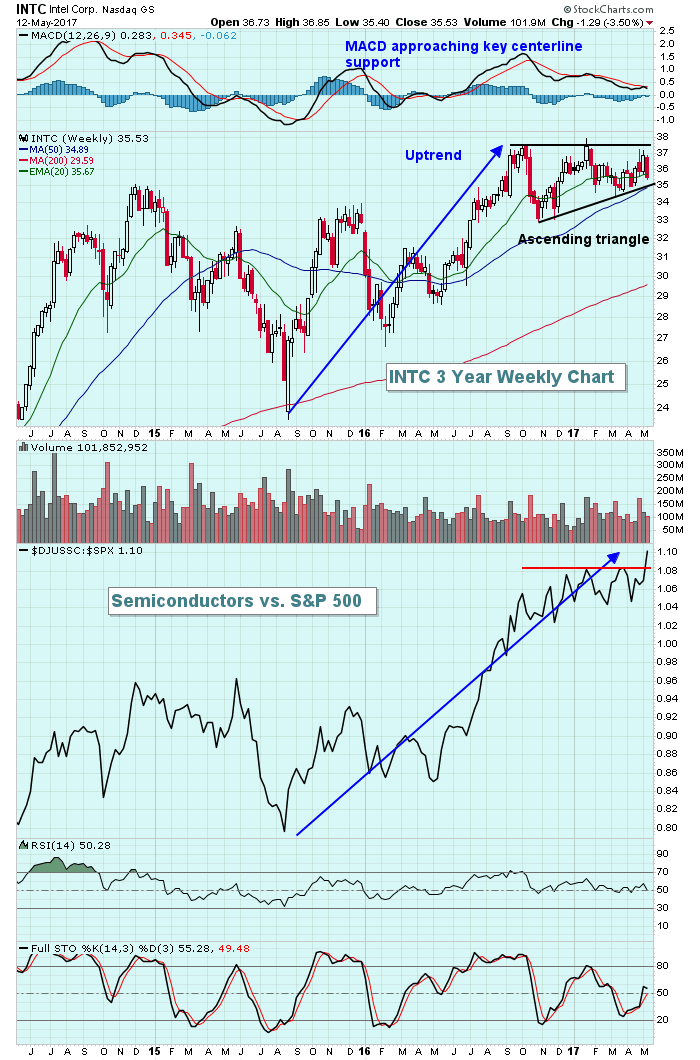 Intel looks like a very solid reward to risk trade at the moment with an ultimate target near 42 and a closing stop set near recent price support at 34.50. In an ascending triangle pattern, the "measurement" is determined by the distance from the top of the triangle pattern to the first low that's connected. That's roughly 4.5. If you add that to the 37.50 breakout level, the "target" would be 42.
I love the fact that semiconductors continue to outperform the S&P 500, actually breaking out on a relative basis once again last week. With the group in favor, I believe it's only a matter of time before INTC joins the party.
Happy trading!
Tom


