A lot of people who analyze the market including portfolio managers will talk about supply and demand, or the battle between buyers and sellers. This could not be more evident in the Russell Tracking ETF (IWM). Since December 9th the IWM has been in a sideways trading range, whereas the NASDAQ has been up humongously since then.
The $RUT is charting some indecision. The rising highs but slightly lower lows suggests the range of indecision is expanding. On April 25th we see the chart gapping up to new highs for the first time in 7 weeks. April 26th the market trades higher but closes mid range. The following day shows an inside day and then a big push down on Friday April 28th as a blue candle. Essentially what happened here is the market ran out of buyers at new highs and the price fell back. We need to wait for the end of today to complete today's price bar, but the 2-month uptrend in Relative Strength appears to be breaking today. If nothing else, its suggesting we pay attention. The horizontal dotted line on the price panel touches the top of the December 9th price bar, and we are struggling to get back above this level again after surging to new highs only two weeks ago. Five months later price reads as unchanged. This 138ish level is a real support/resistance line.
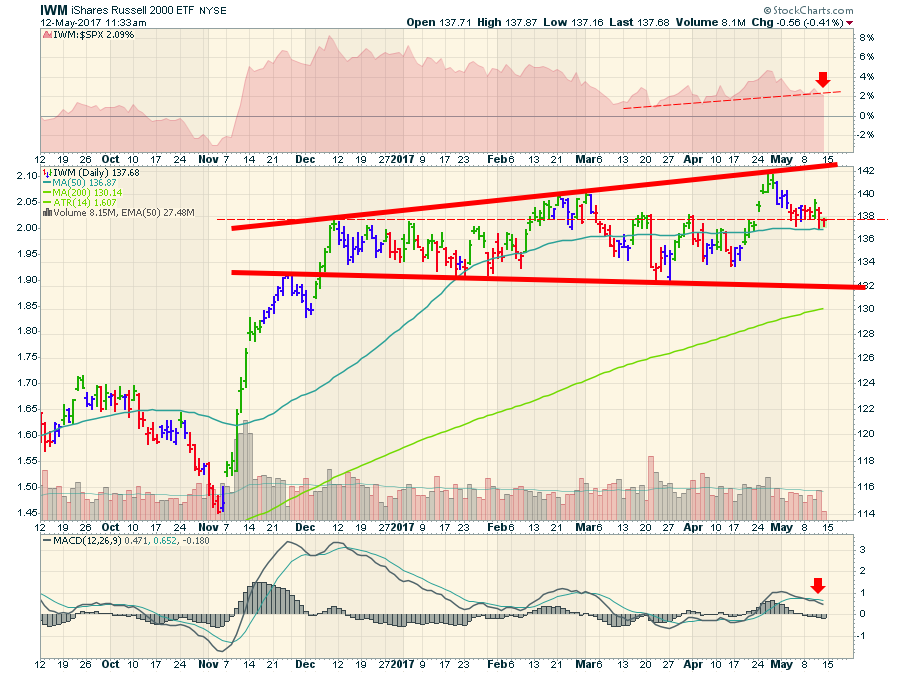
In February we spent 3 weeks above the old high. In April we spent three days. The 50 DMA is flat now. The MACD gave a sell signal this week after a slightly lower high in momentum.
Right now the NASDAQ 100 is trying to push to a new high today. However, the QQQ shows something very interesting. Days after the IWM hit its December 9th high, the QQQ broke its relative strength downtrend and started to outperform the $SPX. The QQQ took over the leadership. Why do I pick December 9th for the IWM? Look at the relative strength in the top panel on the IWM chart above and we can see that is also when the IWM topped out in relative strength.
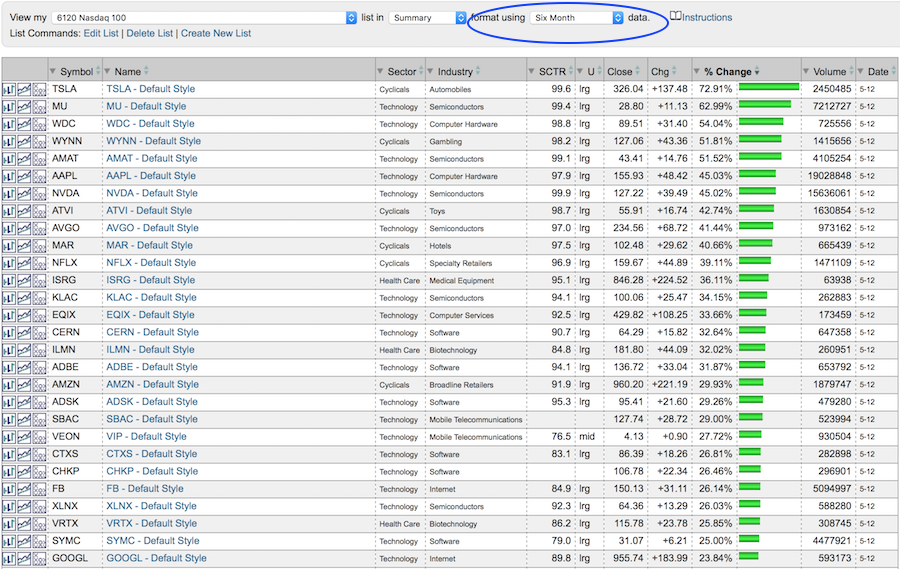
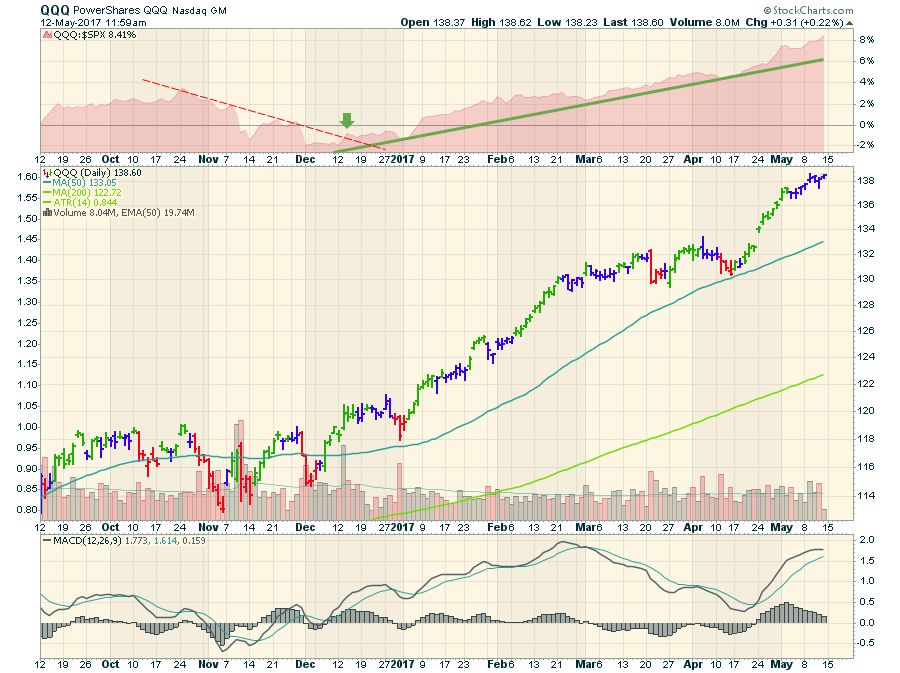 The bottom line is the rotation towards the NASDAQ 100 back in December was important for investors. Since then, the bulk of the market gains have been in the top 100 stocks and really the top 25 of the top 100. Stocks like Facebook, Apple, Netflix, Nvidia, Amazon, Tesla, Alphabet, Microsoft. Working real hard you could almost make FANNATAM the new abbreviation! Here are the performance rankings over the last 6 months for the top performers in the Nasdaq 100.
 As the broader market loses momentum and the rush to fewer and fewer stocks completes, the market eventually runs out of new buyers.
The $RUT suggests a lot of caution on the broad market. The Nasdaq suggests its the place to be until it isn't. Careful here, this is thinning.
I will be with Tom Bowley and Julius de Kempenaer for the Monthly Market Roundup Saturday May 13th at 11 AM EDT. There should be lots of good ideas there. Click here to join us!
 For the educational segment:
It's been a few days since the new Members Tab has arrived. With lots of hot links and more of a control panel feel, it is outstanding. There are some tweaks being added every day.
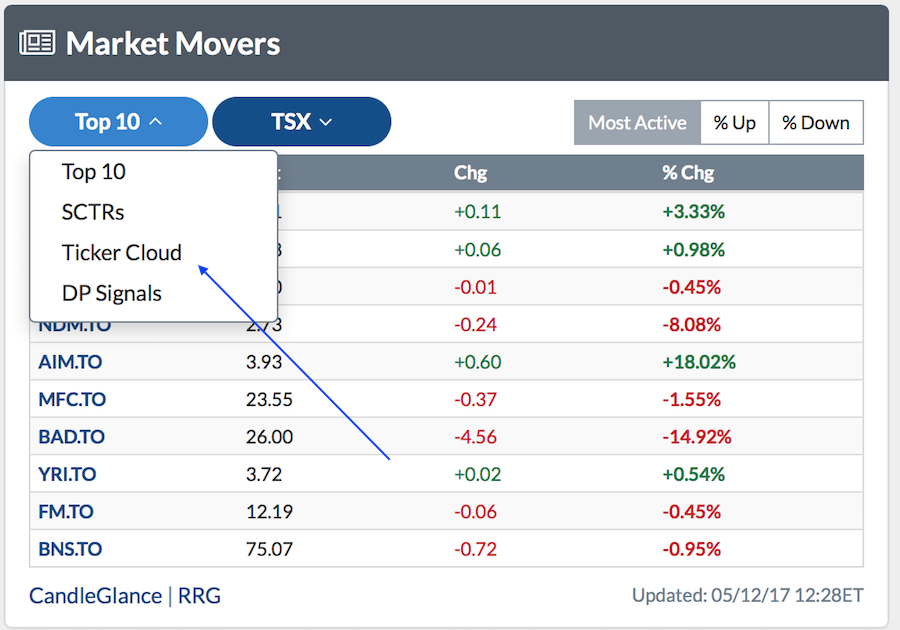
This new link to a smaller ticker cloud is nice!
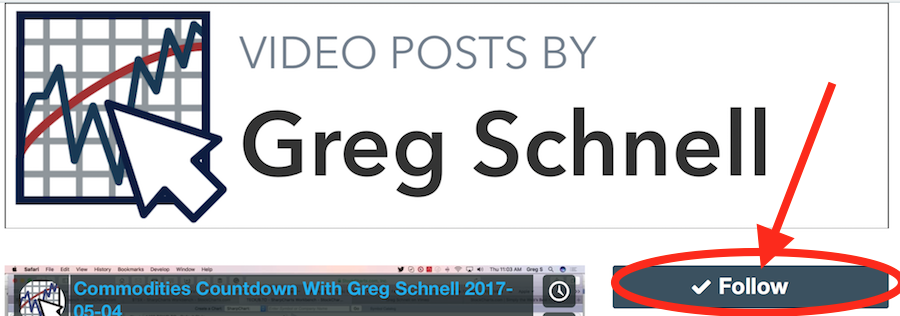
I also recorded an important Commodities Countdown recording 2017-05-11. Click the giant FOLLOW button on the Vimeo page to get notified when there are new recordings. You can also follow me on Twitter @Schnellinvestor.
 See you on the Market Outlook Webinar live or catch the recording!
Good trading,
Greg Schnell, CMT, MFTA


