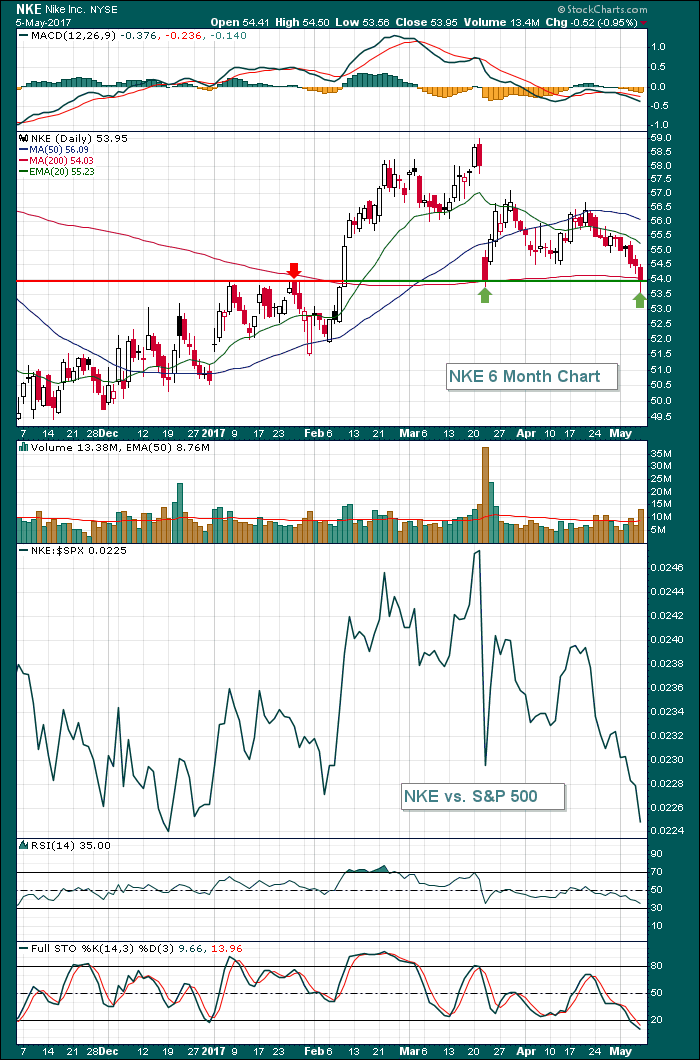
As technicians, we look for prior price resistance to act as solid support once the resistance has been broken. That principle came into play on Nike, Inc. (NKE) as it tested a major price support just beneath 54.00 on Friday. NKE gapped down in the latter part of March and closed at 53.92 on March 22nd on extremely heavy volume. That set a major price support level as NKE had not closed beneath 54.00 (except for that March 22nd close) since breaking out above that level in the second week of February. The following shows key support running through the 54.00 level. Check it out:
 A close beneath 53.75 would be a signal worth paying attention to. Relative support (vs. the S&P 500) near .0224 is being challenged after a steep selloff. Breaking down beneath both the relative support level and the absolute price support level - all on high volume - would likely set NKE up for further deceleration. Stay tuned.
Happy trading!
Tom


