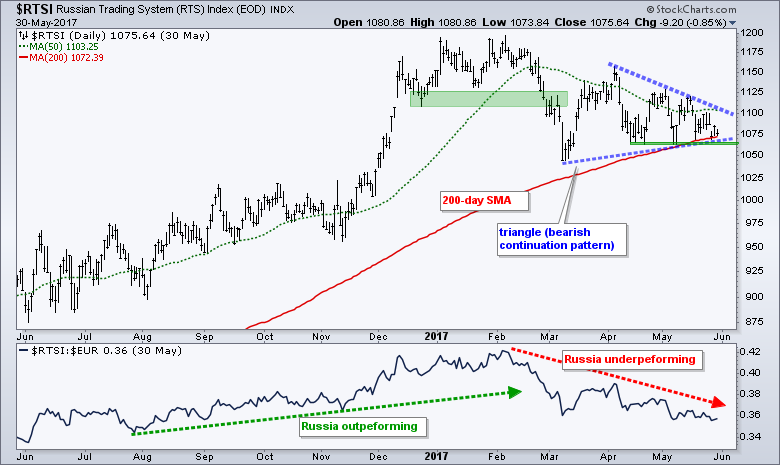
The Russian Trading System Index ($RTSI) is struggling this year and down around 6.5% year-to-date. In contrast, the S&P 500 is up over 7% year-to-date and the Eurotop 100 ($EUR) is up around 6.5%. In addition to relative weakness, the index sports a bearish continuation pattern after a breakdown in February. Notice that the index broke support in February and then formed a triangle the last few months. This triangle represents a rest after the sharp decline and a break below triangle support would signal a continuation lower. Also notice that the rising 200-day SMA is right near triangle support. The triangle measures around 100 points and a break near 1070 would target a move to the 970 area. Take this target with a grain of salt!
 ****************************************
Thanks for tuning in and have a great day!
--Arthur Hill CMT
Plan your Trade and Trade your Plan
*****************************************


