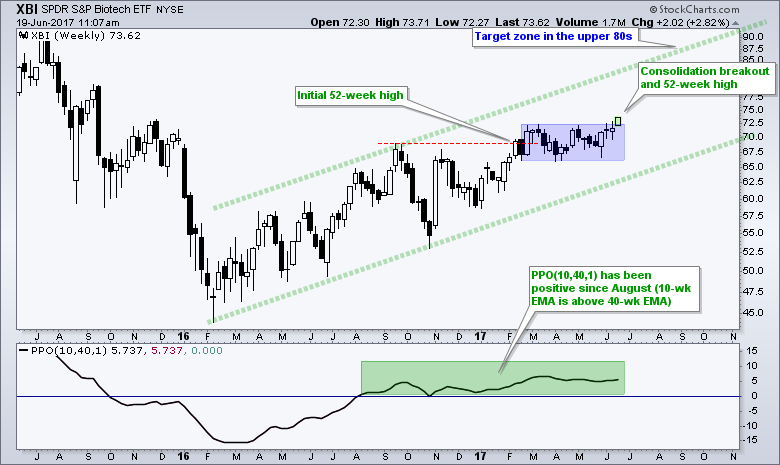
The Biotech SPDR (XBI) is starting to lead the market again with a consolidation breakout and 52-week high. The chart shows the ETF hitting an initial 52-week high in February and then consolidating for four months. It looks like this consolidation is ending and the bigger uptrend is resuming with this week's breakout. Using a parallel channel for a target, the upper trend line extends to the upper 80s by August-September. The indicator window shows the PPO(10,40,1) in positive territory since August 2016 and this confirms the long-term uptrend.
 ****************************************
Thanks for tuning in and have a great day!
--Arthur Hill CMT
Plan your Trade and Trade your Plan
****************************************
