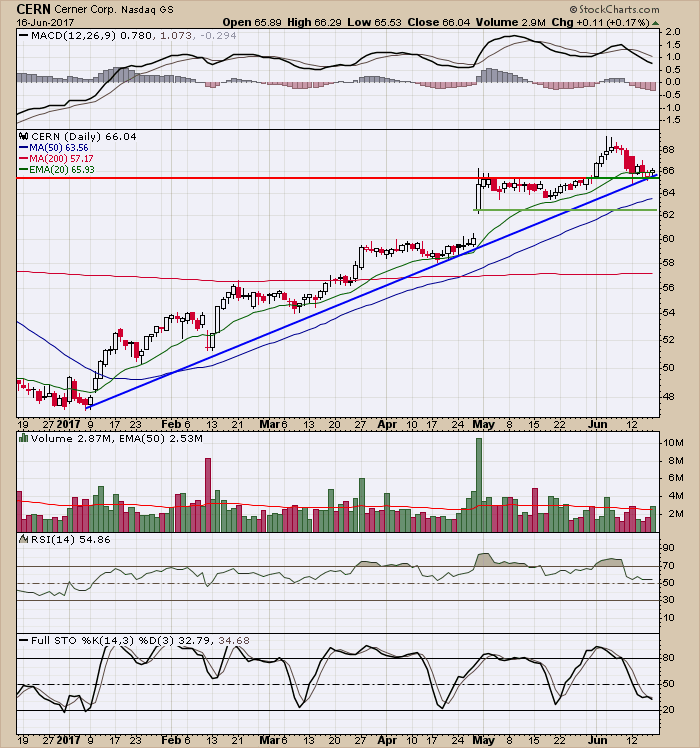
It's always nice to go back to the basics of technical analysis. Broken resistance becomes support. That's currently the case with Cerner Corp (CERN) where the stock recently cleared price resistance just above 65.00 and, with recent profit taking, we've seen a return to that price support level. There's also a nice 2017 uptrend in play that shows multiple touches and CERN is slightly above that trendline support as well. Here's the chart:
 Should 65 price and trendline support fail to hold, the next key level for CERN would be gap support just above 62.
Happy trading!
Tom

About the author:
Tom Bowley is the Chief Market Strategist of EarningsBeats.com, a company providing a research and educational platform for both investment professionals and individual investors. Tom writes a comprehensive Daily Market Report (DMR), providing guidance to EB.com members every day that the stock market is open. Tom has contributed technical expertise here at StockCharts.com since 2006 and has a fundamental background in public accounting as well, blending a unique skill set to approach the U.S. stock market.
Learn More


