The Energy SPDR (XLE) continues to firm after an extended decline and RSI could trigger a bullish signal this week. On the price chart, XLE shows signs of stabilization with an outside reversal five weeks ago and an inside week last week. Notice that XLE is firming near support from last summer's lows and near the 50% retracement. XLE bounced early this week and move above 67.5 would trigger a breakout.
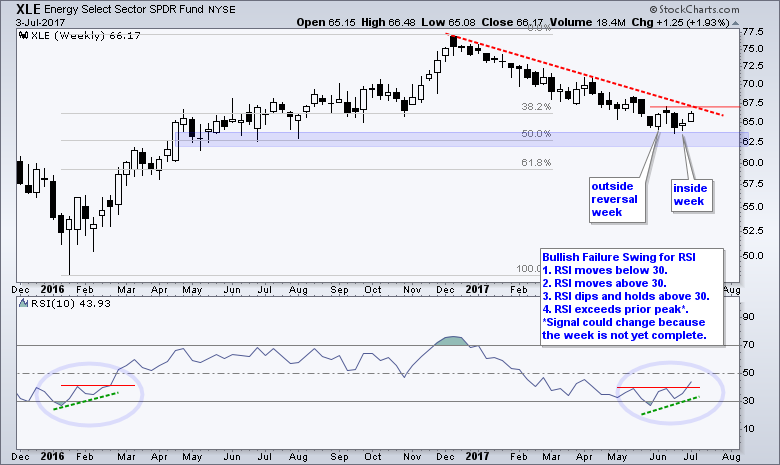
Momentum is improving as 10-week RSI traces out a possible bullish failure swing. Developed by Welles Wilder, the creator of RSI, the bullish failure swing is independent of price and forms with four steps. First, RSI moves below 30 to become oversold. Second, RSI bounces with a move back above 30. Third, RSI pulls back and holds above 30. Fourth, RSI turns back up and breaks above the prior peak. The chart above shows RSI breaking above its prior peak this week, but the weekly bar is incomplete because it is just Monday. We must wait until Friday's close before calling the bullish failure swing complete.
****************************************
Thanks for tuning in and have a great day!
--Arthur Hill CMT
Plan your Trade and Trade your Plan
****************************************


