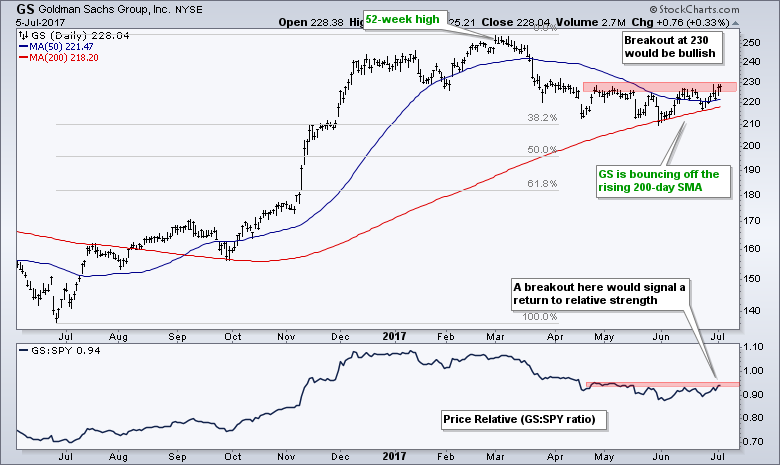
Goldman Sachs (GS) appears to be ending its correction as it bounces off the rising 200-day moving average. The chart shows GS hitting a 52-week high in March and then declining into June. I consider this a correction because the stock was entitled to a pullback after a massive advance and it retraced around 38.2% of the prior move. Goldman found support near the rising 200-day SMA and turned up the last six weeks with a move back above its 50-day SMA. A move above 230 would break a resistance zone and argue for a challenge to the March high. The indicator window shows the price relative (GS:SPY ratio) turning up as well and close to a breakout. As the highest-priced stock in the Dow, Goldman Sachs carries the most weight and a breakout in this stock would be positive for the Senior Average.
****************************************
Thanks for tuning in and have a great day!
--Arthur Hill CMT
Plan your Trade and Trade your Plan
****************************************


