It's rare when stocks line up bullishly from a technical perspective, in addition to both fundamental and seasonal perspectives as well. But that's exactly what I see when looking at Autodesk (ADSK). Let's start with fundamentals. ADSK just reported its latest quarterly earnings and they beat both top and bottom line estimates. Revenues were reported at $502 million, topping the consensus estimate of $495 million. EPS came in at (.11), much better than Wall Street's expectations of (.15).
From a seasonal view, ADSK ranks as the fifth best performing stock (in terms of the percentage of gains earned during the final four months - ADSK has earned 84% of its annual return in the final four months of the year) on the NASDAQ 100 over the final four months of the calendar year (September - December). Check this out:
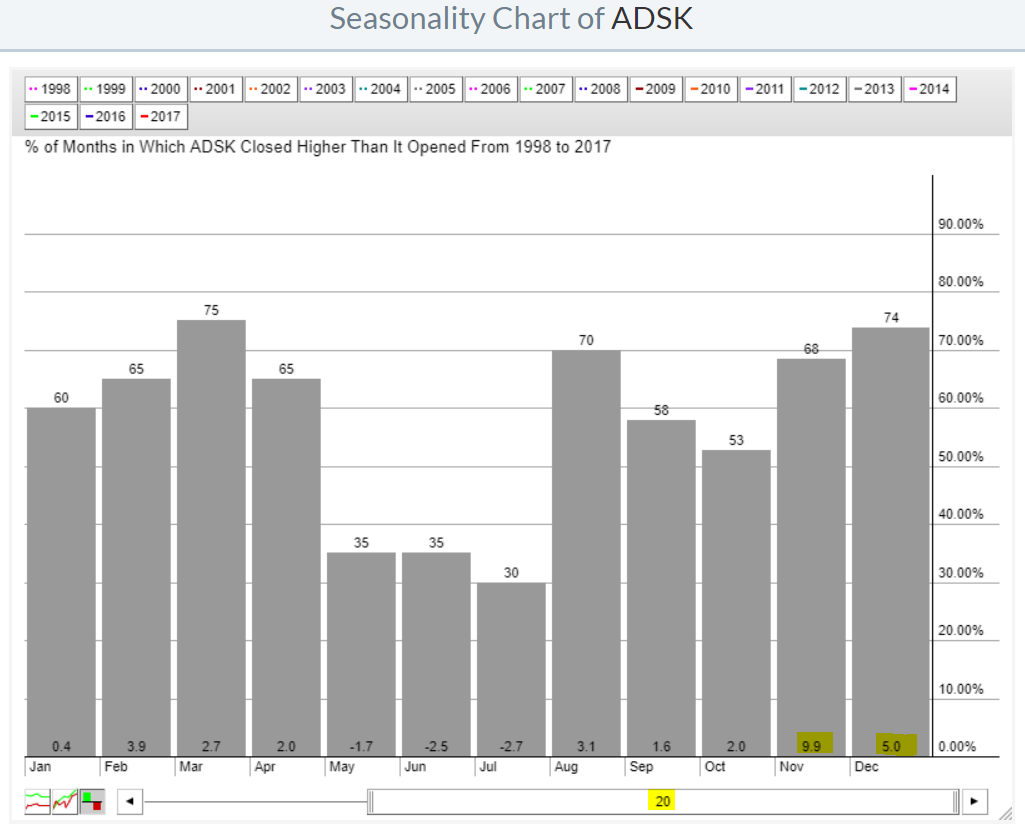 November is an astounding month, when ADSK averages gaining 9.9% over the past 20 years. In my Trading Places blog on Friday, I revealed the top NASDAQ 100 stock in terms of September-December performance. You can CLICK HERE for that article, then scroll down to Historical Tendencies. I also discussed a few of the other NASDAQ 100 stocks that produce most of their gains from September through December on MarketWatchers LIVE on Friday. You can access that information by watching the recording HERE. The seasonality discussion begins at roughly one hour and eleven minutes into the show if you want to fast track to that point in the video.
Finally, ADSK jumped after its earnings report, clearing 114.97 resistance on the open and then closing there at the end of the session. Check out the bullish continuation pattern that preceded yesterday's action:
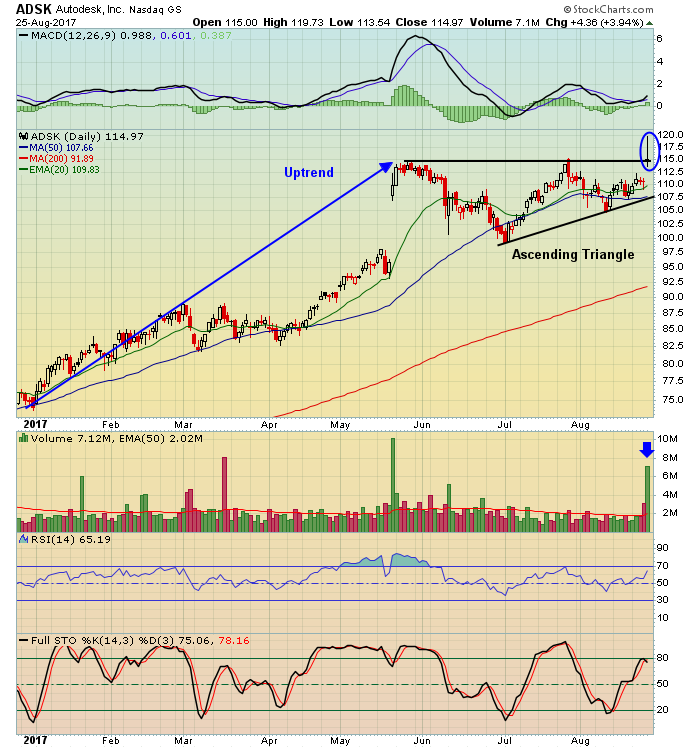 Given the doji that printed, we could see an initial gap fill and 20 day EMA test near 111, but from there I expect to see higher prices on ADSK. My target is 132, the measurement on the ascending triangle breakout, and my stop is a close beneath 107, which would represent a break of recent price, 50 day SMA and trendline support levels. To see a similar response after earnings, and a subsequent test of the rising 20 day EMA, check out the daily chart on Agilent Technologies (A).
(Full Disclosure: I bought shares of ADSK on Friday and plan to add if the rising 20 day EMA is tested)
Happy trading!
Tom


