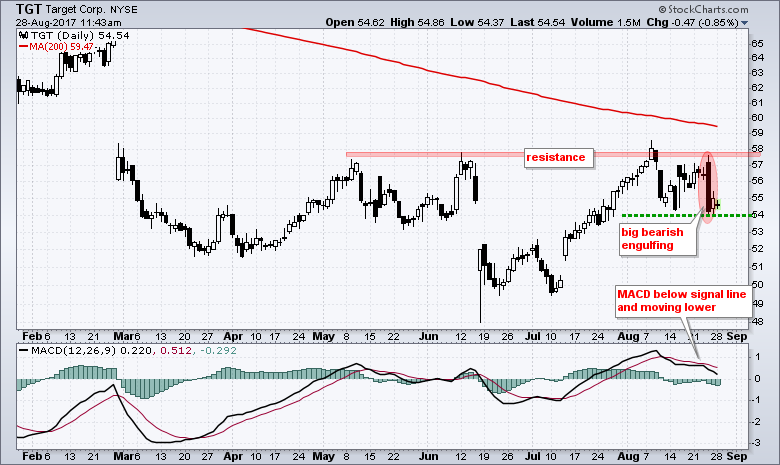
The Retail SPDR (XRT) is one of the worst performing industry group ETFs and Target (TGT) is one of the downside leaders. Even though the stock is up sharply since early July, it is down over 20% year-to-date and seriously lagging the broader market in 2017. Note that SPY is up around 10% year-to-date. Target is in a long-term downtrend because it is well below the falling 200-day SMA and it hit a 52-week low in June. More recently, the stock hit resistance in the 57-58 area four times since May and formed a large bearish engulfing pattern last week. This marks a clear reversal at resistance and I would use this to signal a continuation of the long-term downtrend. MACD is also weakening.
Follow me on Twitter @arthurhill - Keep up with my 140 character commentaries.
****************************************
Thanks for tuning in and have a good day!
--Arthur Hill CMT
Plan your Trade and Trade your Plan
*****************************************


