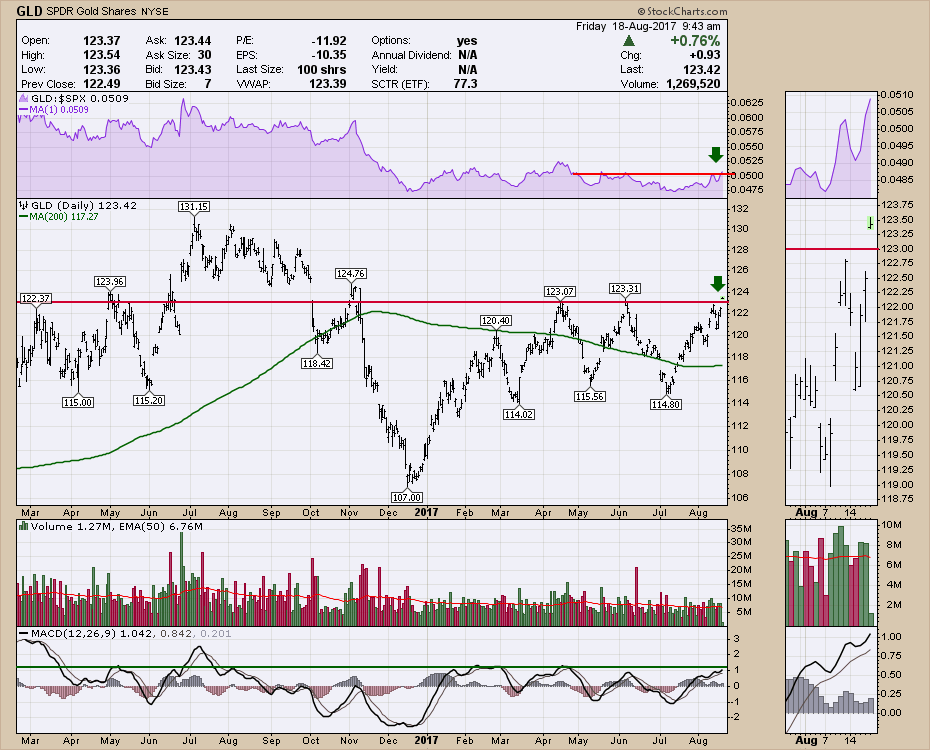
$GOLD topped last year in July. The Gold miners topped August 12th. After spending a year in decline, the last six months of that have been base building. This morning, the pre-market action has $GOLD above $1302.00. For Commodity investors, Copper has been performing well. It's nice to see Gold join the party.
The Relative Strength is breaking out to new three-month highs, The price is through resistance this morning and the volume shown in the zoom box has been coming in above average on every up day, and below average on most down days. The big picture is also excellent!
It might take another week for this to start cooking, but it's definitely time to check out related trades in precious metals. This subject also appeared last week on this blog, so I am trying to highlight it.
I'll be hosting Market Watchers Live today. You can follow along as I review this Gold breakout, PnF charts, using alerts, and the overall market indicators. I also posted a Commodities Countdown Video recording 2017-08-17 on my Vimeo channel and you can access that here.
Commodities Countdown Video With Greg Schnell 2017-08-17 from StockCharts.com on Vimeo.
Have a great weekend,
Greg Schnell, CMT, MFTA


