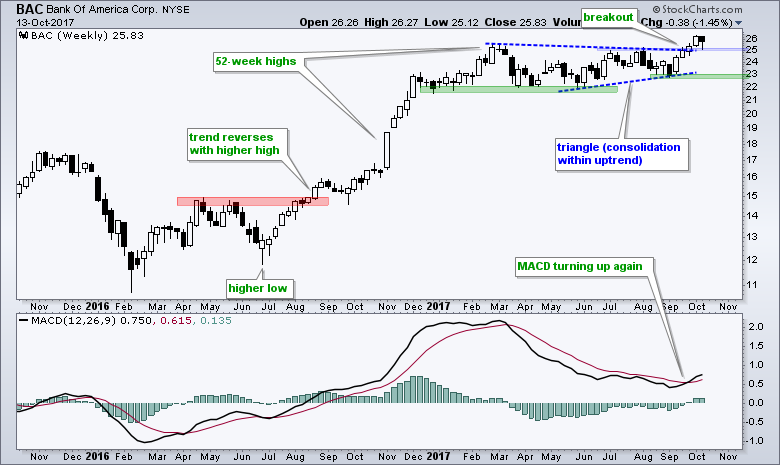
Bank of America (BAC) broke out of a large bullish continuation pattern three weeks' ago and this breakout is holding. Overall, BAC surged from June 2016 to February 2017 and then consolidated with a large triangle pattern. A consolidation within an uptrend is a bullish continuation pattern and the breakout around 25 signaled a continuation of this uptrend. The breakout zone around 25 turns into the first support level to watch. A close back below 25 would throw cold water on the breakout and warrant a re-evaluation. I would not, however, turn completely bearish because this would not be enough to reverse the long-term uptrend. The August lows mark key support for the long-term uptrend. The indicator window shows momentum improving as MACD turns up and moves above its signal line.
Follow me on Twitter @arthurhill - Keep up with my 140 character commentaries.
****************************************
Thanks for tuning in and have a good day!
--Arthur Hill CMT
Plan your Trade and Trade your Plan
*****************************************
