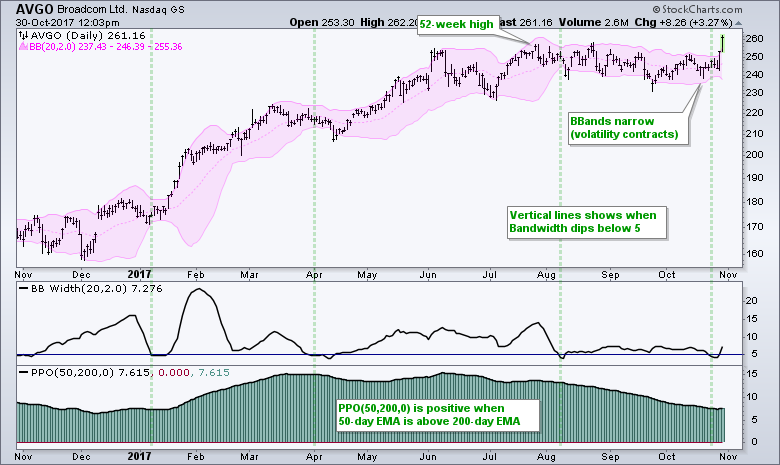
BroadCom looks set to continue its long-term uptrend with a breakout and fresh 52-week high. The chart shows BroadCom (AVGO) with Bollinger Bands, the Bandwidth indicator and the Percentage Price Oscillator (PPO). First, notice that the stock hit a 52-week high in July and the PPO(50,200,0) has been above zero all year, which means the 50-day EMA is above the 200-day EMA. The long-term trend is clearly up and this means our trading bias should be bullish. In other words, we should expect bullish resolutions to short-term setups.
The pink area on the price chart shows Bollinger Bands narrowing from August to October as volatility contracted, which is typical for a trading range. The green vertical lines show BandWidth dipping below 5% four times over the past year. These dips tell us that volatility was at the low end of the 12 month range. The January and April dips preceded big advances in the stock, but the August dip was a dud. The fourth dip occurred last week and the two day breakout suggests that prices are headed higher in the coming weeks or months.
Follow me on Twitter @arthurhill - Keep up with my 140 character commentaries.
****************************************
Thanks for tuning in and have a good day!
--Arthur Hill CMT
Plan your Trade and Trade your Plan
*****************************************

