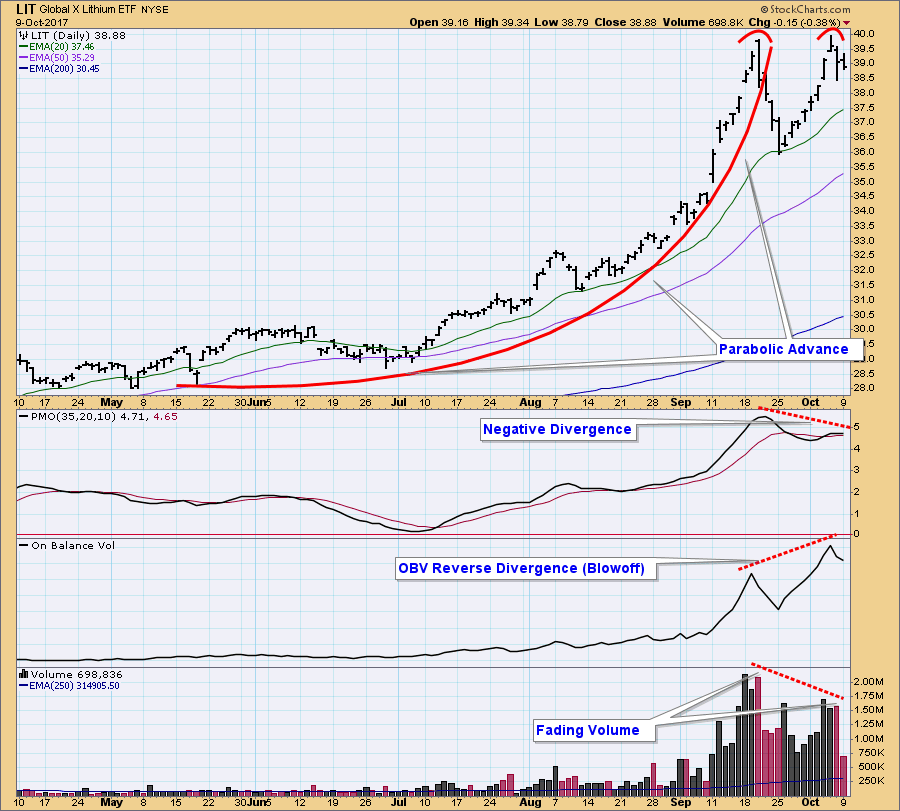
This morning I saw a commercial for the Global X Lithium ETF (LIT), and I thought, "Hmmm, lithium . . . batteries for iPhones, MacBooks, etc." So I pulled up a chart of LIT, and all kinds of things jumped out at me.
First I saw the parabolic advance that got so steep it collapsed. Next there is the snapback rally that had price back to the previous high, at which point it backed off to form a double top.
The PMO formed a negative divergence, which compares equal price tops to a lower PMO top.
The OBV has formed a reverse divergence, which compares equal price tops with a higher OBV top. What this tells us is that there was an internal blowoff when higher OBV could not push price above the previous price top.
Finally, there was a negative divergence formed when daily volume bars on the upward price push in October showed fading support relative to the higher volume shown in September.
This chart is very bearish.
Happy Charting!
- Carl
Technical Analysis is a windsock, not a crystal ball.
**Don't miss DecisionPoint Commentary! Add your email below to be notified of new updates"**
Helpful DecisionPoint Links:
DecisionPoint Shared ChartList and DecisionPoint Chart Gallery
Price Momentum Oscillator (PMO)
Swenlin Trading Oscillators (STO-B and STO-V)


