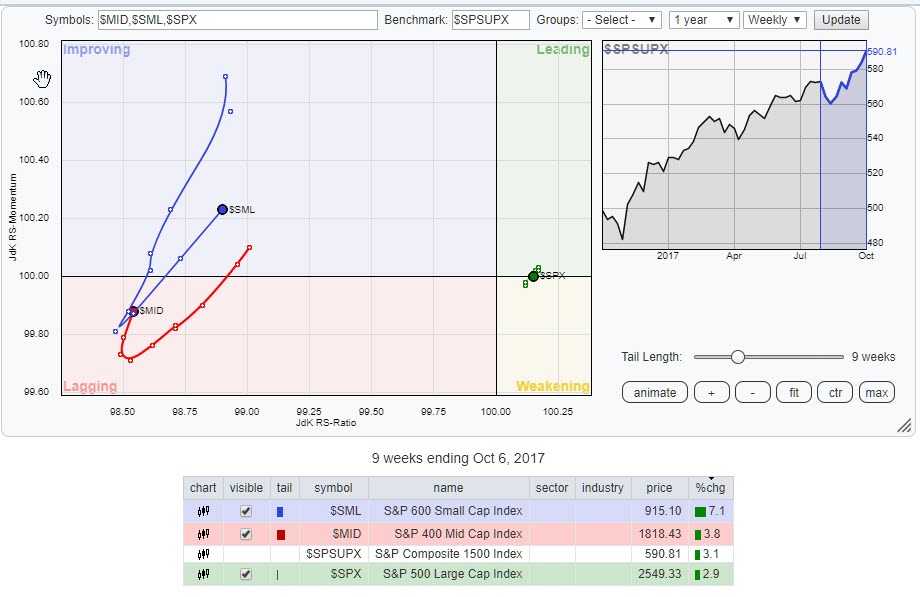
 The Relative Rotation Graph above shows the rotation of the three size indices that make up the S&P Composite 1500 index.
Although the S&P 500 large cap index ($SPX) is still clearly on the right-hand side of the RRG, making very small rotations close to the 100-level on the JdK RS-Momentum scale some interesting moves seem to be playing out on the left-hand side of the plot.
Large caps took over from small- and mid-caps in April and the preference has been for $SPX since and for the moment still is. But the Relative Rotation Graph of these three components against the broad market S&P 1500 index is sending some early warning signals.
The tails of both the small-cap and the mid-cap indices are significantly longer than for the large-cap index AND both have a positive RRG-heading (North-East) where $SPX has a negative (South West) heading.
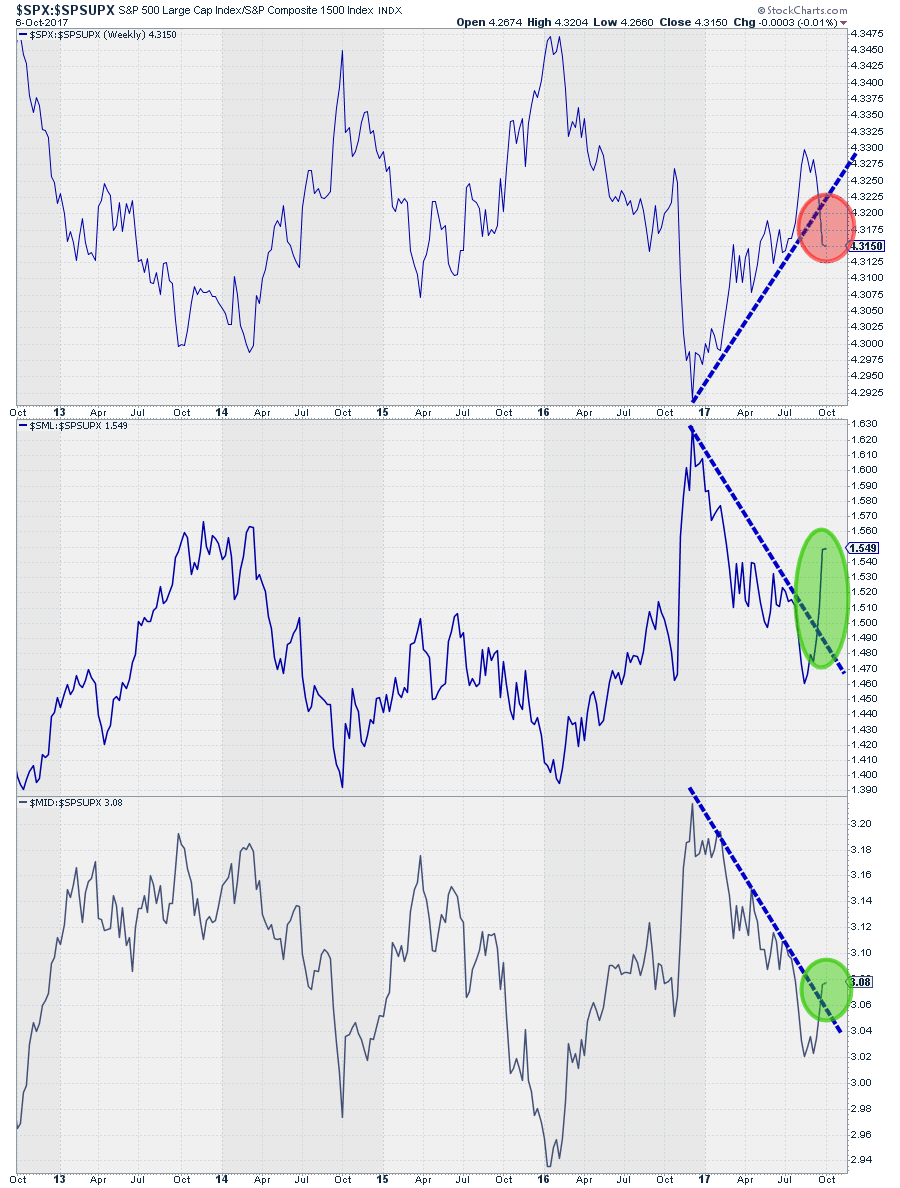
As it's only three items on the chart I have plotted all three indices against $SPSUPX below
 The opposite trends for $SPX (upward) versus $SML and $MID (downward) is well visible but so are the three breaks which seem to be taking place all at the same time i.e. NOW!
Especially in $SPX and $SML the breaks are clear where $MID needs a bit more confirmation but the fact that things are changing is evident, at least for the short term.
So in coming weeks keep an eye on this RRG and the accompanying ratios for the three components of $SPSUPX.
If you like to receive a notification anytime, a new article is posted in the RRG blog, please leave your email address here "Notify Me!"
Julius de Kempenaer | RRG Research
RRG, Relative Rotation Graphs, JdK RS-Ratio, and JdK RS-Momentum are registered TradeMarks by RRG Research
Follow RRG Research on social media:
If you want to discuss RRG with me on SCAN, please use my handle Julius_RRG so that I will get a notification


