While we've seen many indices, ETFs and individual stocks break out over the past several weeks, there are still many that are consolidating in bullish fashion and those, upon breakout, provide solid trading opportunities. Enter DXC Technology Company (DXC). Over the past two months, the S&P 500 has risen nearly 100 points (roughly 4%) while DXC has quietly consolidated and worked off short-term overbought conditions. It's how the market works. Leaders lead, consolidate, then lead again. DXC's two month consolidation appears to have ended rather emphatically on Friday as you can see below:
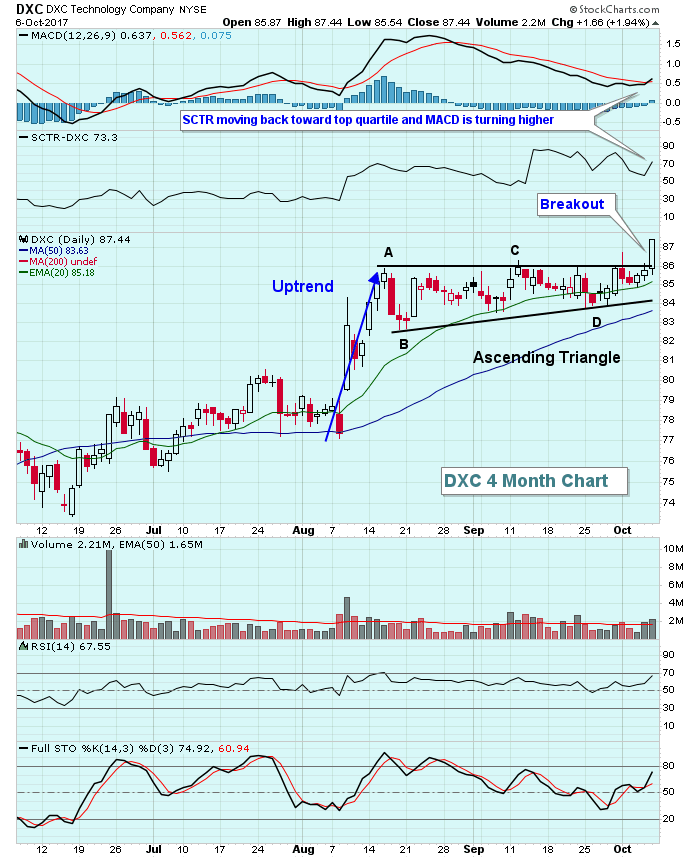 The breakout of this textbook ABCDE ascending triangle pattern came on 2.2 million shares, or about 30% above the 50 day moving average volume of 1.65 million shares. That higher volume confirms the pattern in my opinion and I would expect a measurement initially to the 90 level. Support should be found at both price support just above 86 and the rising 20 day EMA, currently at 85.18.
The breakout also triggered a quick rise in the SCTR back above 70 and nearly into the top quartile of stocks. Strong volume trends and a rising SCTR suggest bullish days ahead for DXC.
Happy trading!
Tom


