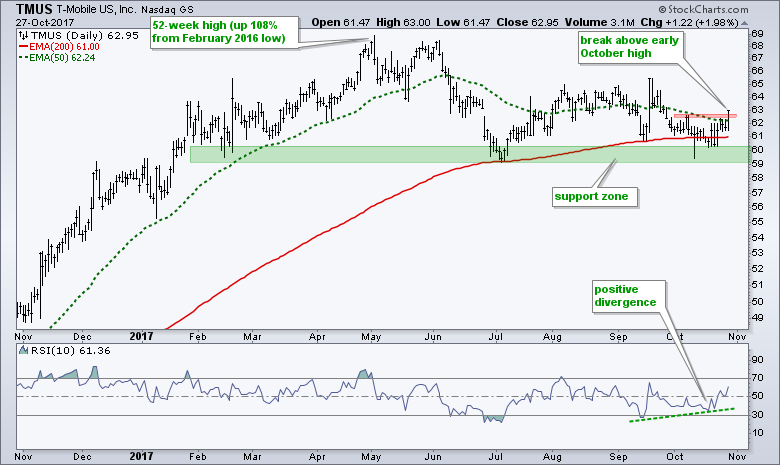
T-Mobile is showing signs of life with an upturn off support and a positive divergence in RSI. As always, lets review the bigger picture before trying to make sense of current conditions. TMUS basically doubled from February 2016 to April 2017 with a 108% advance. This massive advance gave way to a pullback into July and the stock found support near 60. The 50-day EMA is above the 200-day EMA and the stock has been battling the 200-day EMA the last two months. Given the evidence, I would assume that the long-term trend is up.
Signs of life are emerging because the stock tested support in October and bounced over the last two weeks. Notice that TMUS clear the October high and is back above the two EMAs. Thus, it looks like the stock is turning up off support and poised to continue its bigger uptrend. The indicator window shows RSI with a positive divergence from September to October. Note that I do not use divergences unless they are in harmony with long-term trend. In other words, if the 50-day EMA was below the 200-day EMA, I would ignore this positive divergence because it is not in harmony with the bigger uptrend. In any case, the divergence is really just icing on the cake as far as I am concerned. All the information we need is on the price chart. I would re-evaluate this bullish setup should the stock close below 60.
Follow me on Twitter @arthurhill - Keep up with my 140 character commentaries.
****************************************
Thanks for tuning in and have a good day!
--Arthur Hill CMT
Plan your Trade and Trade your Plan
*****************************************

