In the top-right corner of the homepage at StockCharts.com, there is a table that holds "Market Movers". It defaults to the top10 "most active" in the S&P 500 but you can change that using the buttons and drop-downs.
Below the table, you will find links to view the stocks in this table in CandleGlance or RRG format. Clearly, I am interested in the latter ;)
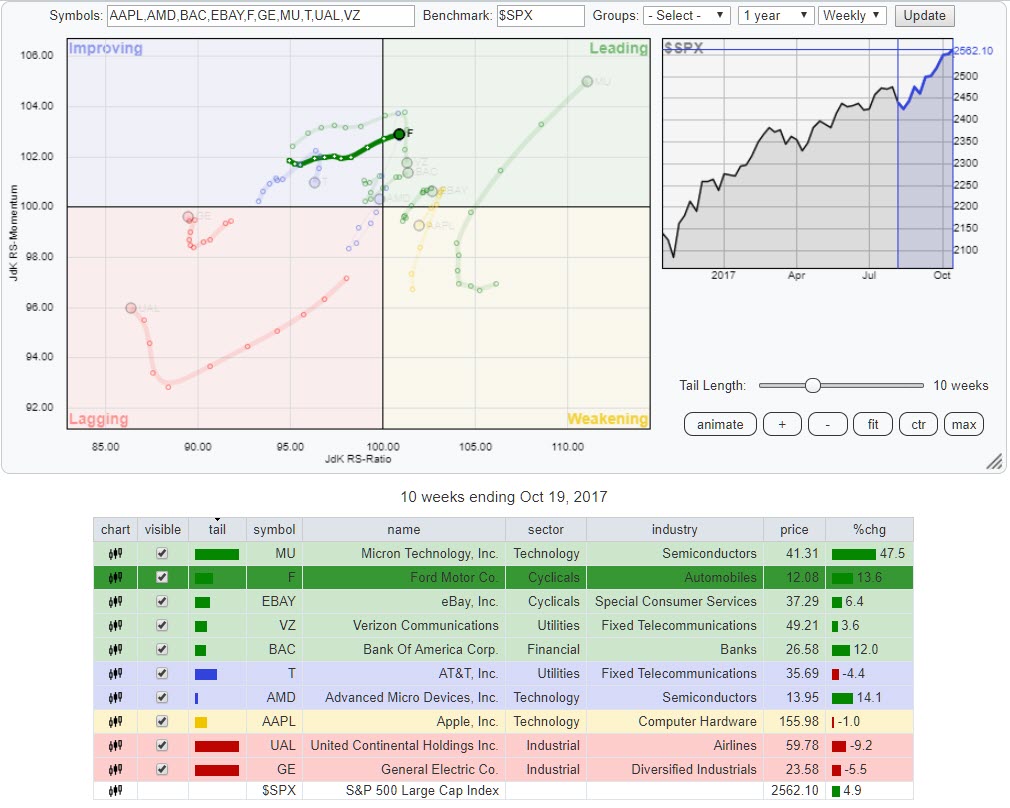
After the close of Thursday 10/19 (what a date right?) the Relative Rotation Graph for the ten most active stocks in the S&P 500 index looks as plotted above.
There were two stocks that catch my attention. The first one is MU, far away inside the leading quadrant and powering ahead at a strong RRG-Heading. However, given the strong move, it has already gone through it may be too far into the rotation already to pick it up now.
The other one is F (Ford Motor Co.) as it is just entering the leading quadrant and moving at a positive (between 0-90 degrees) RRG-Heading. I have selected F in the table below the RRG to make it stand out from the other stocks on the chart and better see the rotational pattern over the past five weeks.
Based on the rotation and the current RRG-Heading more relative upside performance may be expected in coming weeks.
Here's the chart:
Ford Motor Co. - F
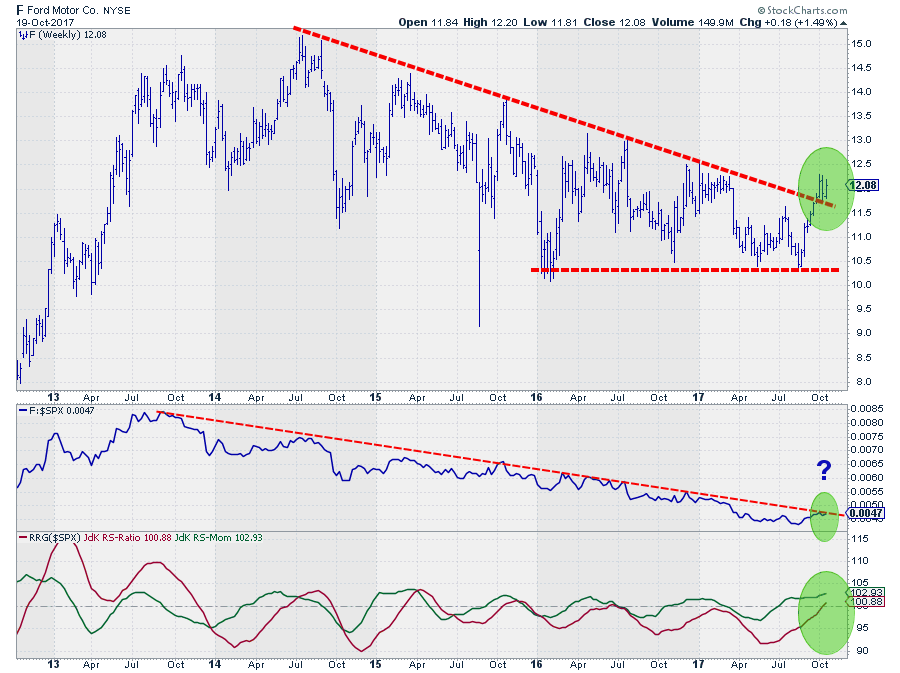
The relative strength for Ford against the S&P 500 started to move in a downtrend from the peak back in 2013. Looking at the downward sloping resistance line over the peaks in the RS-line that trend is still intact.... or is it?
The combination of RRG-Lines has caused Ford to move over into the leading quadrant recently when the JdK RS-Ratio followed JdK RS-Momentum above the 100-level. This suggests that a new relative uptrend is starting for F against $SPX.
This has happened a few times, unsuccessfully, before in 2015 and 2016. The difference now is that we have an upward break above falling resistance on the price chart. This break should be able to provide the fuel needed to push the RS-line above its resistance as well.
For the time being the double support around $ 11.50 (previous high and former falling resistance) will now act as support (buying level) while a break beyond resistance at $ 12.50 confirms that a new series of higher highs and higher lows has started.
This makes it a chart that should not be ignored!
If you like to receive a notification anytime, a new article is posted in the dedicated RRG blog, please leave your email address and click "Subscribe"
Julius de Kempenaer | RRG Research
RRG, Relative Rotation Graphs, JdK RS-Ratio, and JdK RS-Momentum are registered TradeMarks by RRG Research
Follow RRG Research on social media:
If you want to discuss RRG with me on SCAN, please use my handle Julius_RRG so that I will get a notification
