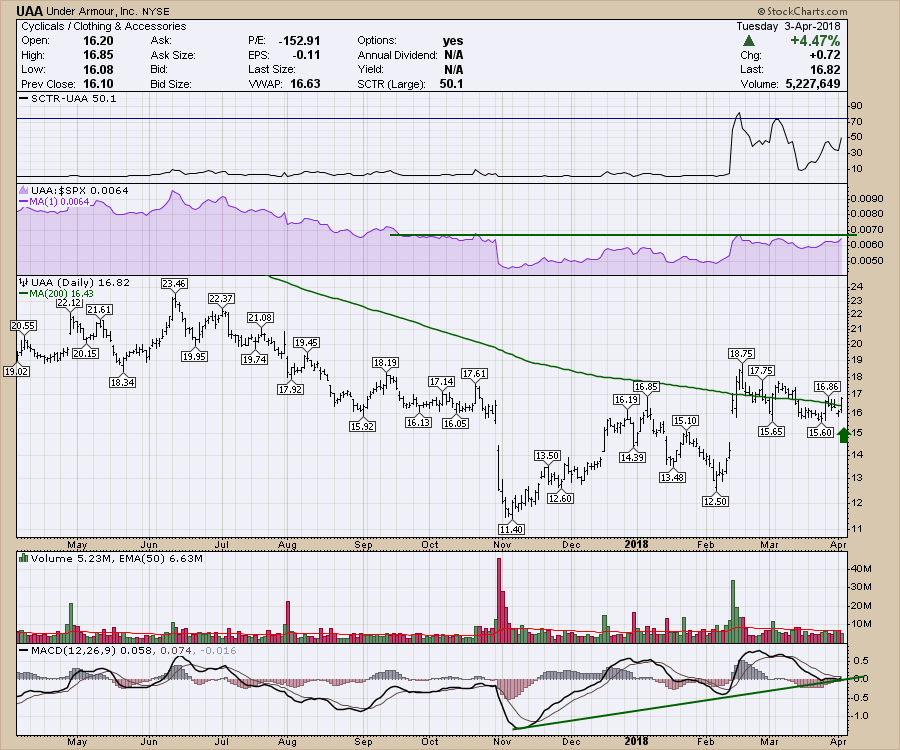
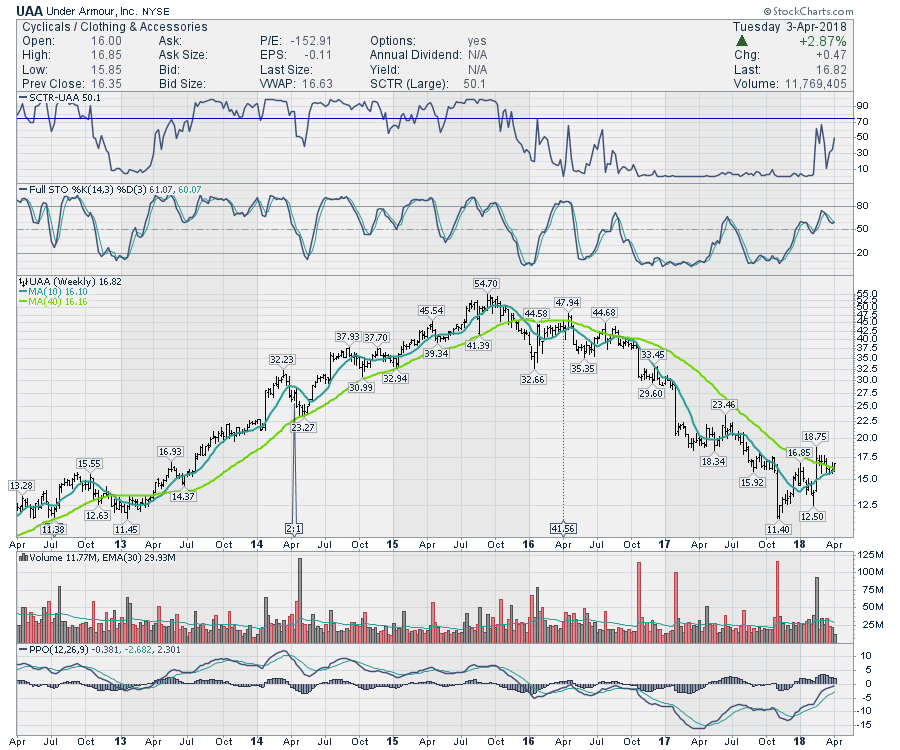
A lot of the clothing retailers have been out of favor for a while. Recently, some significant moves have taken place in retailers. ANF, TPR, NKE have all pushed up in the last six months. Under Armour (UAA) has been a little slow to launch but it is close to breaking out to new 6-month highs. You can see the moving averages are above to make a positive cross.
The $17.50 level looks important on the weekly chart above. The SCTR is starting to kick up which is usually a good indication. One concern on the weekly chart is the PPO is still below zero.
On the daily, the 200 day moving average is hugging the price action. A push here looks like a real possibility to start the breakout. The MACD is just pushing above zero.
 I will be hosting the Market Watchers Live show all week with Erin. You can find that link on the tab called StockCharts TV to watch live market analysis at Noon ET.
 In case you haven't heard, Stockcharts.com launched StockCharts TV April 2, 2018. On the StockCharts TV tab, you can follow a 24 hour schedule of Technical Analysis tips and tools. This is truly the biggest thing in Technical Analysis in 2018. It is free, so give it a try. We had huge viewership in the first 24 hours!
Good trading,
Greg Schnell, CMT, MFTA


