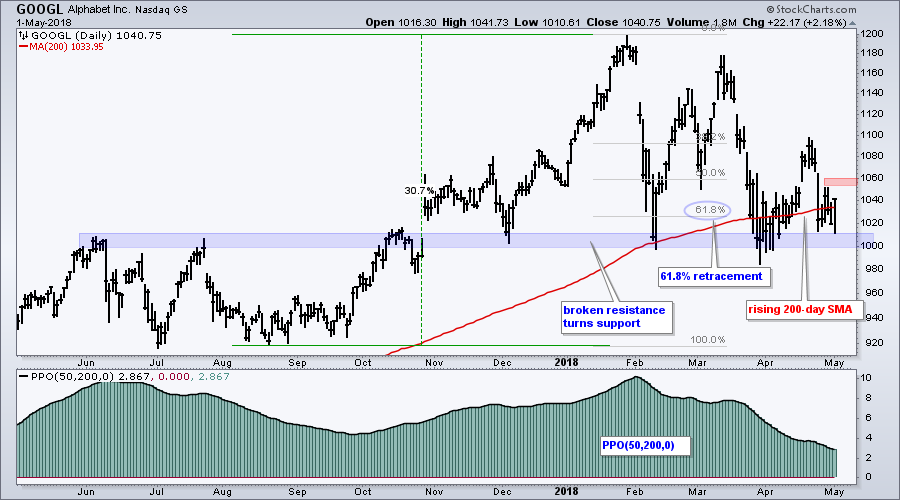
 It has been a rough year for Alphabet, also known as Google, but the stock is still in a long-term uptrend and firming near a solid support zone. This could give way to a bounce.
First, the stock advanced some 30% and hit a 52-week high in January. Second, the PPO(50,200,0) is positive and this means the 50-day EMA is above the 200-day EMA. Even though the stock is some 13% below its January high, I still think the long-term trend is up.
This year's decline occurred with three legs: down into early February, up into mid March and down into early April. I don't really use Elliott Wave, but this could be a classic ABC correction. Also notice that the correction retraced around 61.8% of the prior advance. Cue Twilight Zone music...
Yes, the stock overshot the Fibonacci retracement, but I think we need to use zones when dealing with correction targets. Also notice that the stock found support near broken resistance with three lows over the last five months. Thus, there is more than one piece of evidence pointing to support in the 1000-1020 area.
Overall, Google is in a long-term uptrend, trading near support and in a retracement area where corrections often end. Hmm.... this could give way to a bounce. The red zone marks first resistance at 1060 and I would watch this level for the first signs of an upturn (breakout).
Plan Your Trade and Trade Your Plan.
- Arthur Hill, CMT
Senior Technical Analyst, StockCharts.com
Book: Define the Trend and Trade the Trend
Twitter: Follow @ArthurHill


