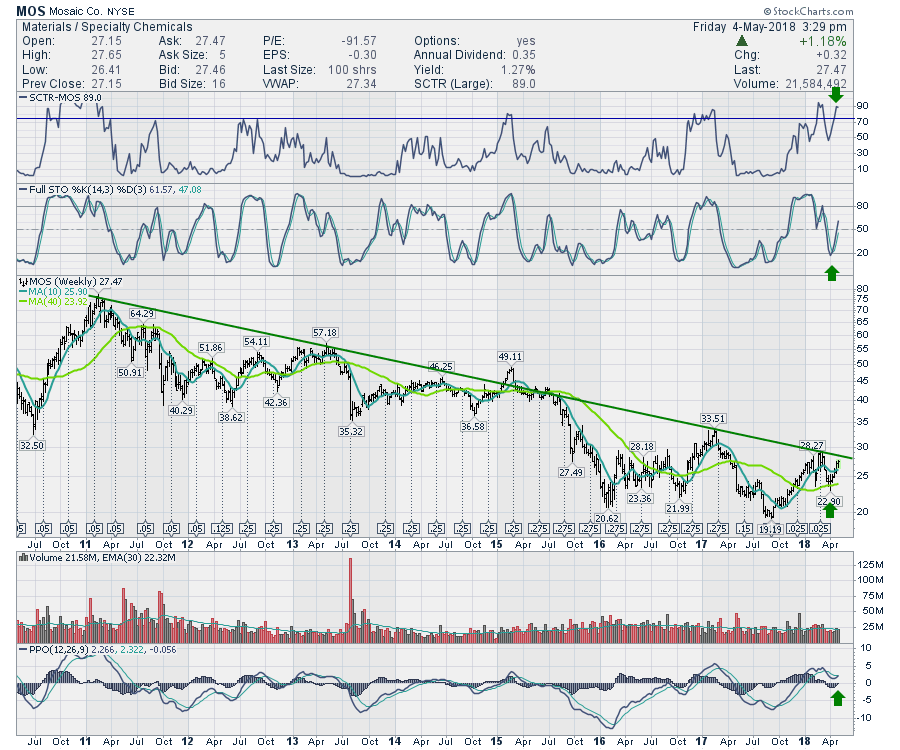
Mosaic's chart looks like an endless river of pain. So much so, why would anyone look at the stock for investment? Well, a couple of signals have kicked up that make it worthy of a second look now.
First of all, the SCTR recently gave us a signal by moving above 75. Then the SCTR scaled back to 45 and moved back above the 75 level. This is a common occurrence on stocks when they start to outperform. So that is a real positive that I like to see. Full stochastics have pushed back above 50. The stock price has bounced off the 40 week moving average which is bullish. It has also formed a higher low. Now we need to see a higher high which is a move above $29.20 which would also be 52 week highs.
The weekly volume has been high but average. This ticker symbol averages 22 Million a day which is fantastic for a chart with such a major downtrend. One of the signals I like here is the PPO making a positive cross while above zero for the first time in 5 years! Looking at the chart, it had a failed PPO signal in June 2013 with the positive cross, but the SCTR was not outperforming. These signals working together create a positive bias in my book. I think the stop can be nice and tight at the 10 WMA.
Good trading,
Greg Schnell, CMT, MFTA

