 I highlighted a number of bull flags in Tuesday's show (On Trend), and there were some breakouts. These breakouts, however, were not very convincing because stocks closed weak and gave back their early gains.
Today I will highlight the flags in JP Morgan (JPM) and Morgan Stanley (MS). Note that JPM is the largest holding in XLF and accounts for 11.36% of the SPDR. MS weighs in at 2.22%.
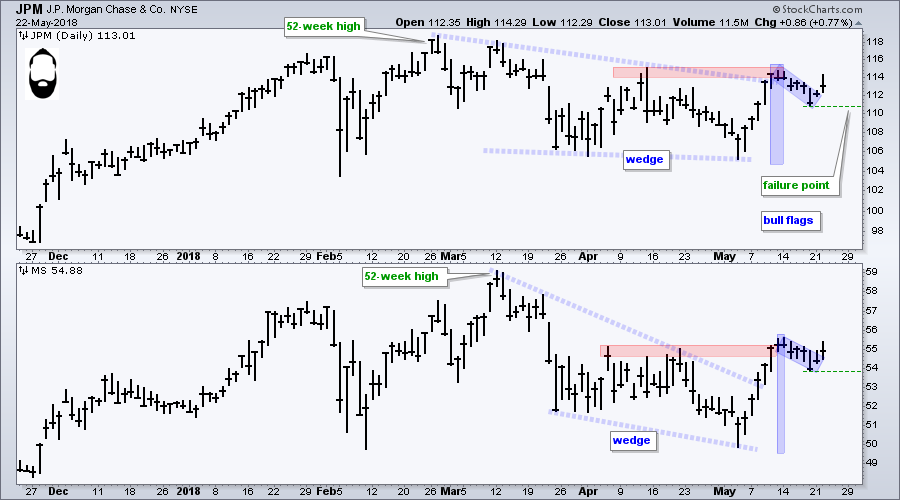
The chart below shows both stocks challenging their April highs (red zone) with surges in early May. Both stocks then fell back last week and formed falling flag patterns. With a bounce the last two days, they broke out of their flag patterns and this is short-term bullish.
 Tuesday's close was hardly inspiring, but the flag breakouts have yet to be negated. The green lines mark support from the flag lows and these are the first levels to watch for failure.
Highlights from On Trend
On Trend can be seen Tuesday's at 10:30 and 11:00 AM ET on StockChartsTV. The show repeats throughout the week and is also archived on our Youtube Channel. Here are the topics covered on May 22nd.
- Setting the Trend and Trading Bias
- Playing the Swings within a Pattern
- Charts: SPY, MOO, ABT
- Analyzing Flags, Pennants and Wedges
- Stocks: XLF, JPM, MS, AKAM, SOXX, MXIM
- Patterns versus Mean Reversion
- Drawing, Filling and Tilting Shapes
- Click here to watch on Youtube
Plan Your Trade and Trade Your Plan.
- Arthur Hill, CMT
Senior Technical Analyst, StockCharts.com
Book: Define the Trend and Trade the Trend
Twitter: Follow @ArthurHill
>


