 The healthcare sector is coming alive on Monday and leading the broader market. As with the S&P 500, this sector struggled in 2018 and the Health Care SPDR (XLV) is up around 1.5% year-to-date. SPY, for reference, is up almost 3% this year.
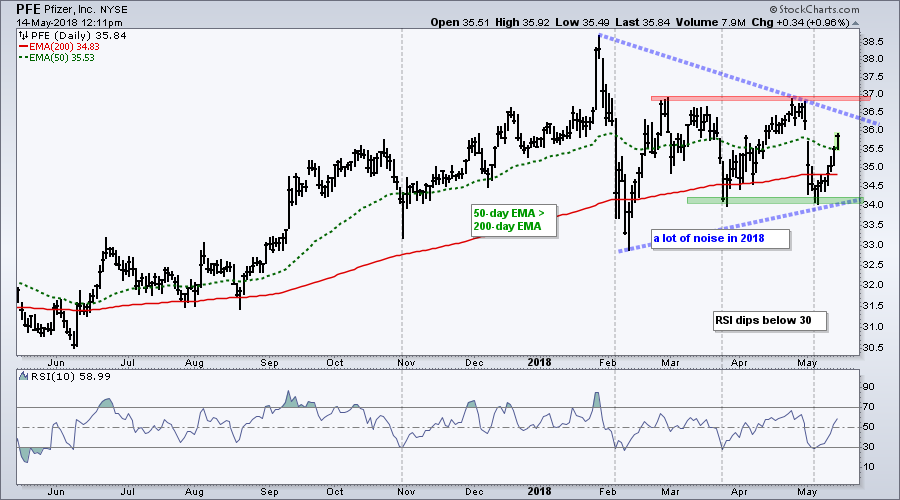
The chart below shows Pfizer (PFE) with a steady uptrend until January and an erratic range since late January. The range started with a sharp decline into early February and traced out a triangle of sorts the last three months.
Despite an erratic 2018, I still think the long-term trend is up and this is a consolidation within that uptrend. The stock hit a new high in January, and the 50-day EMA is above the 200-day EMA.
Pfizer established clear support and resistance levels to watch for the next directional signal. A break above the February-April highs would be bullish and signal a continuation of the bigger uptrend, while a break below the March-May low would be bearish and could lead to a bigger trend reversal.
Plan Your Trade and Trade Your Plan.
- Arthur Hill, CMT
Senior Technical Analyst, StockCharts.com
Book: Define the Trend and Trade the Trend
Twitter: Follow @ArthurHill


